Fig. 1.
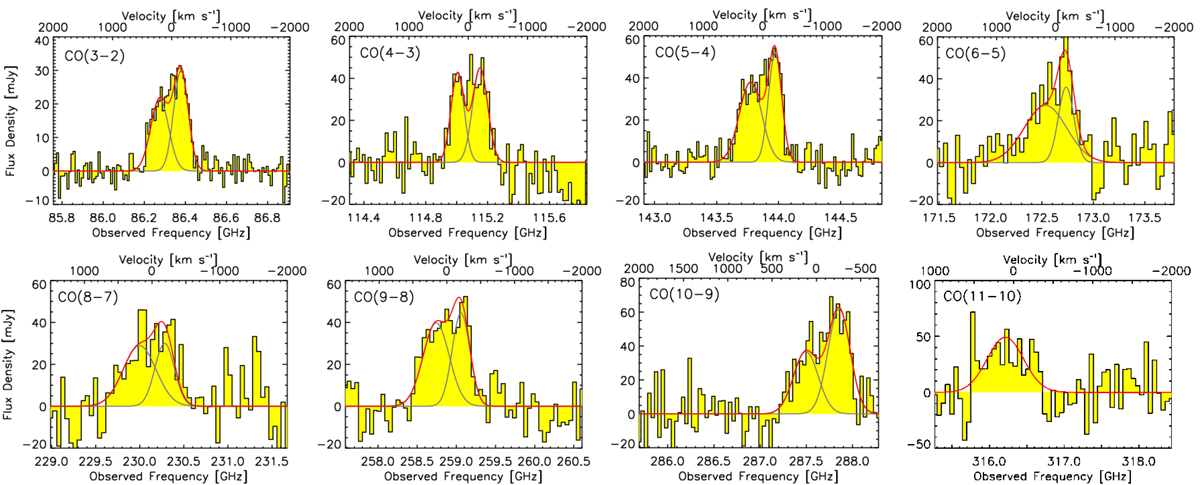
Single-dish spectra of the CO rotational emission lines in PLCK_G244.8+54.9 observed with EMIR. The continuum-subtracted and binned spectra were fitted with two Gaussian components using the CLASS package of GILDAS, by fixing the peak velocities to those measured on the CO(3–2) spectrum. The best-fit line profiles are plotted as red curves, with the individual spectral components overlaid in gray. Velocity offsets are defined relative to the best spectroscopic redshift z = 3.0054 ± 0.0001 presented in Table 1. The resulting line properties are listed in Table A.2 and EMIR spectra of other Planck’s dusty GEMS are shown in Appendix A.
Current usage metrics show cumulative count of Article Views (full-text article views including HTML views, PDF and ePub downloads, according to the available data) and Abstracts Views on Vision4Press platform.
Data correspond to usage on the plateform after 2015. The current usage metrics is available 48-96 hours after online publication and is updated daily on week days.
Initial download of the metrics may take a while.