Fig. A.1.
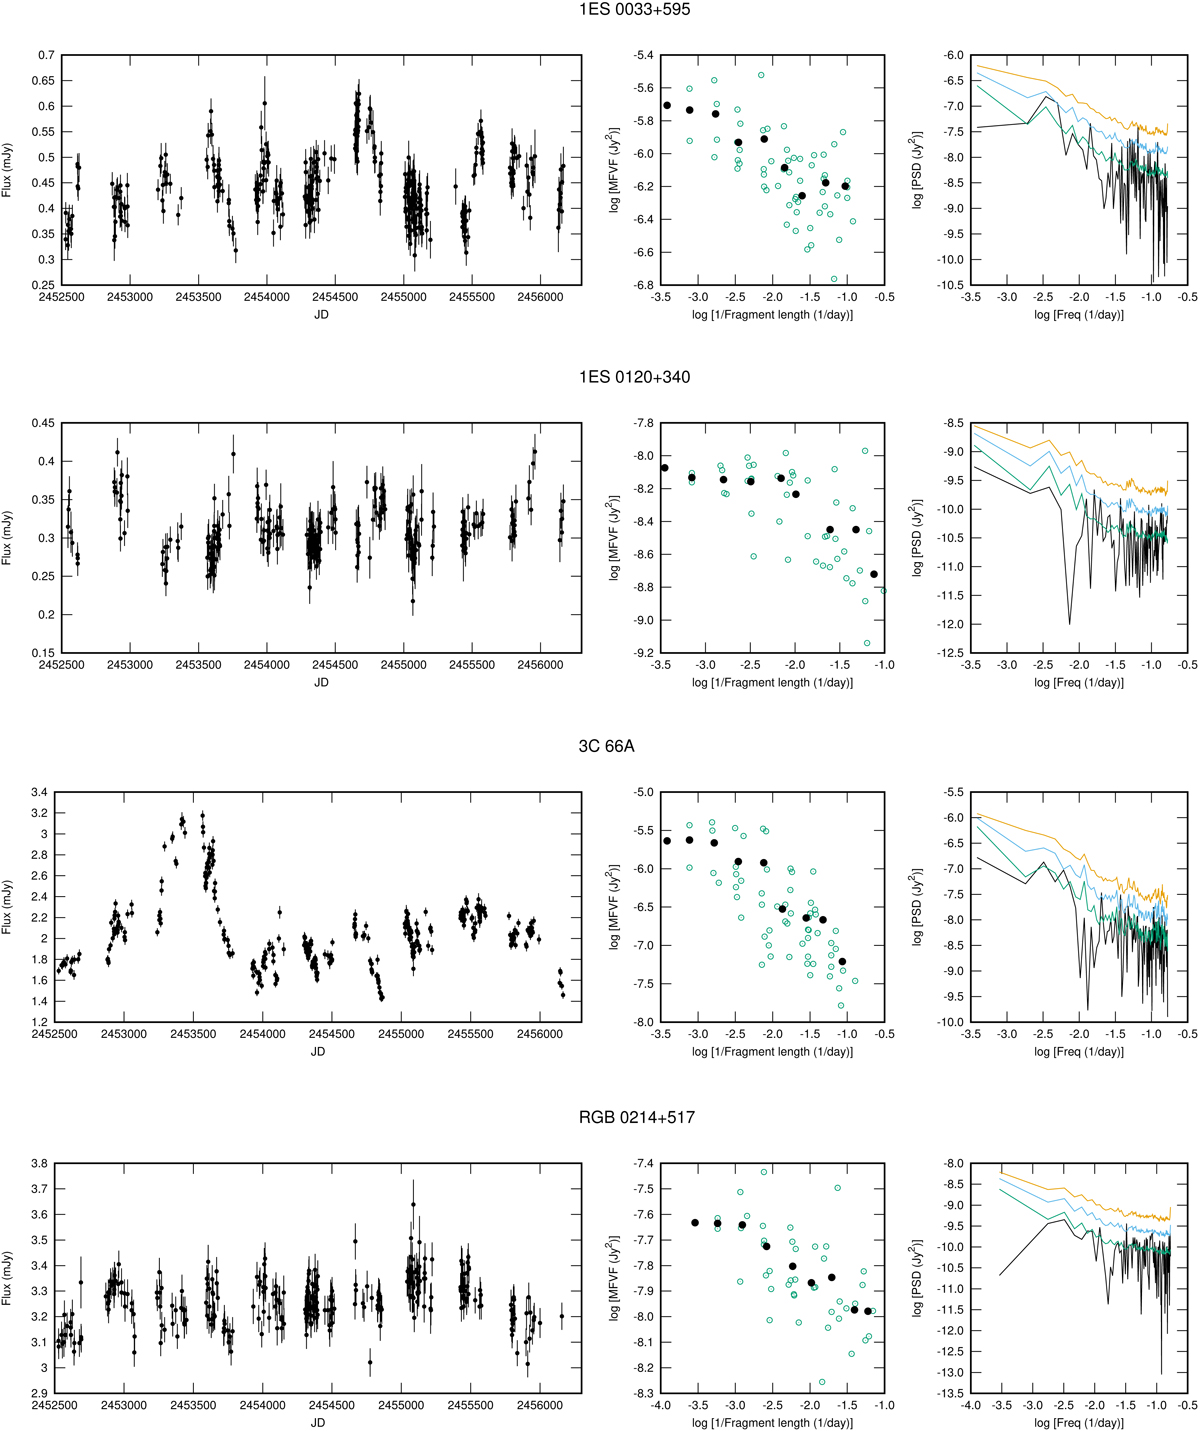
Left panels: observed light curve. Middle panels: multiple fragments variance function (MFVF). Gray dots show the unbinned values and black dots the binned values. Right panels: power spectral density (PSD) together with 67%, 95%, and 99.9% limits for a single frequency, taking into account the number of frequencies covered. The two rightmost panels were computed from data transformed to the rest frame.
Current usage metrics show cumulative count of Article Views (full-text article views including HTML views, PDF and ePub downloads, according to the available data) and Abstracts Views on Vision4Press platform.
Data correspond to usage on the plateform after 2015. The current usage metrics is available 48-96 hours after online publication and is updated daily on week days.
Initial download of the metrics may take a while.