Fig. 2.
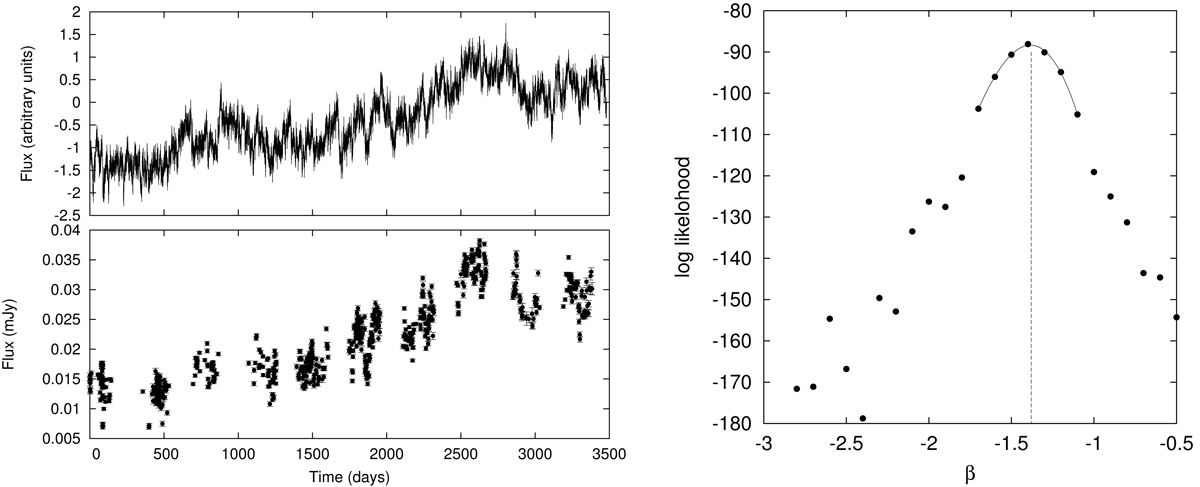
Illustration of different phases of the analysis. Upper left panel: evenly sampled light curve generated with β = −1.4. This curve was cut from a longer set ∼100 times longer than shown here. Lower left panel: simulated curve resampled to the observing epochs of Mkn 421 and with instrumental noise added. Right panel: likelihood curve of Mkn 421 with the MFVF. The maximum of the polynomial fit (solid line) corresponds to β = −1.38.
Current usage metrics show cumulative count of Article Views (full-text article views including HTML views, PDF and ePub downloads, according to the available data) and Abstracts Views on Vision4Press platform.
Data correspond to usage on the plateform after 2015. The current usage metrics is available 48-96 hours after online publication and is updated daily on week days.
Initial download of the metrics may take a while.