Fig. 5
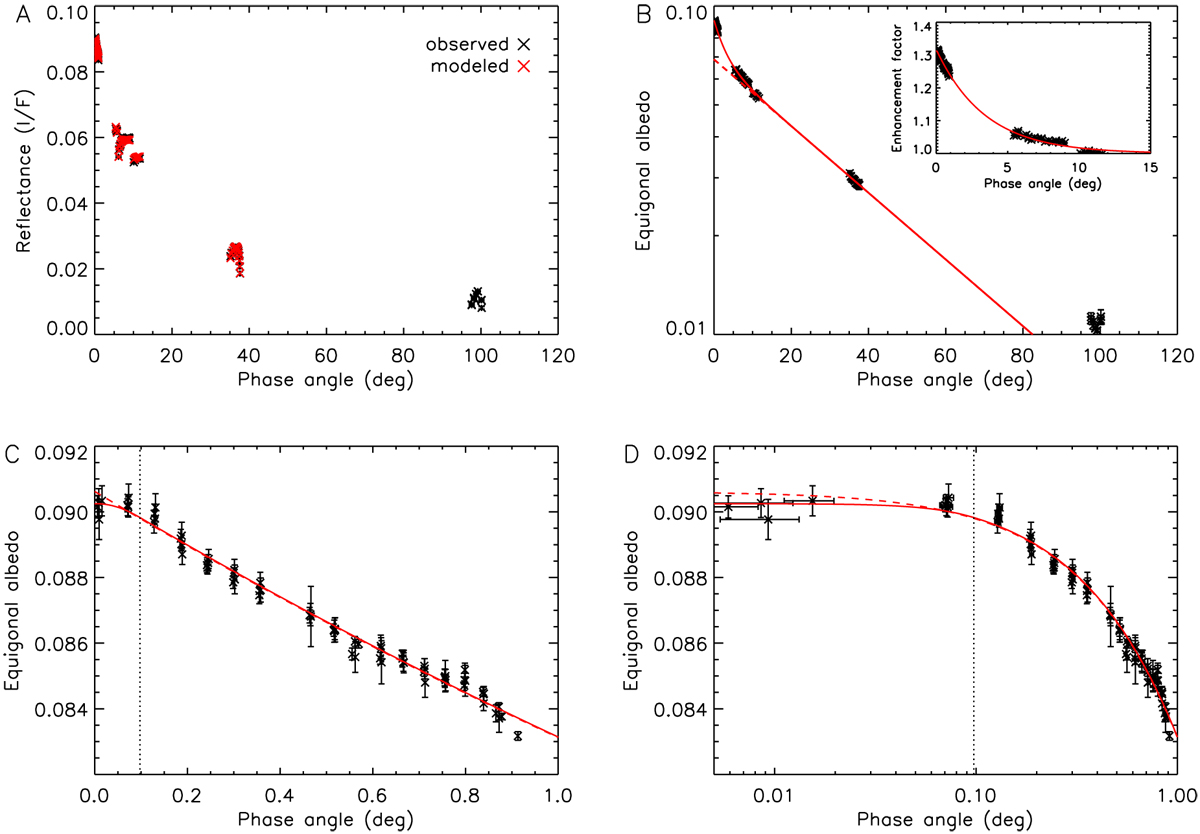
Fitting the Akimov model to the average reflectance in a box of 3 × 3 pixels centered on the location of the green star in Fig. 4A. The fit, with parameters (A0, ν1, m, ν2) = (0.091, 0.023, 0.32, 0.32), was limited to data with 0.05° < α < 40° and ι, ϵ< 70°. Panel A: reflectance. Panel B: equigonal albedo (logarithmic scale), with the best-fit model from panel A drawn in red. The inset shows the enhancement factor, or the equigonal albedo divided by the “linear” part of the phase curve (dashed red line). Panel C: zooming in on the phase angle range below 1°. The solid curve accounts for the finite size of the Sun, whereas the dashed curve does not. The vertical dotted line indicates the angular radius of the Sun at Ceres. Panel D: as in panel C, but with the phase angle on a logarithmic scale.
Current usage metrics show cumulative count of Article Views (full-text article views including HTML views, PDF and ePub downloads, according to the available data) and Abstracts Views on Vision4Press platform.
Data correspond to usage on the plateform after 2015. The current usage metrics is available 48-96 hours after online publication and is updated daily on week days.
Initial download of the metrics may take a while.