Fig. 3
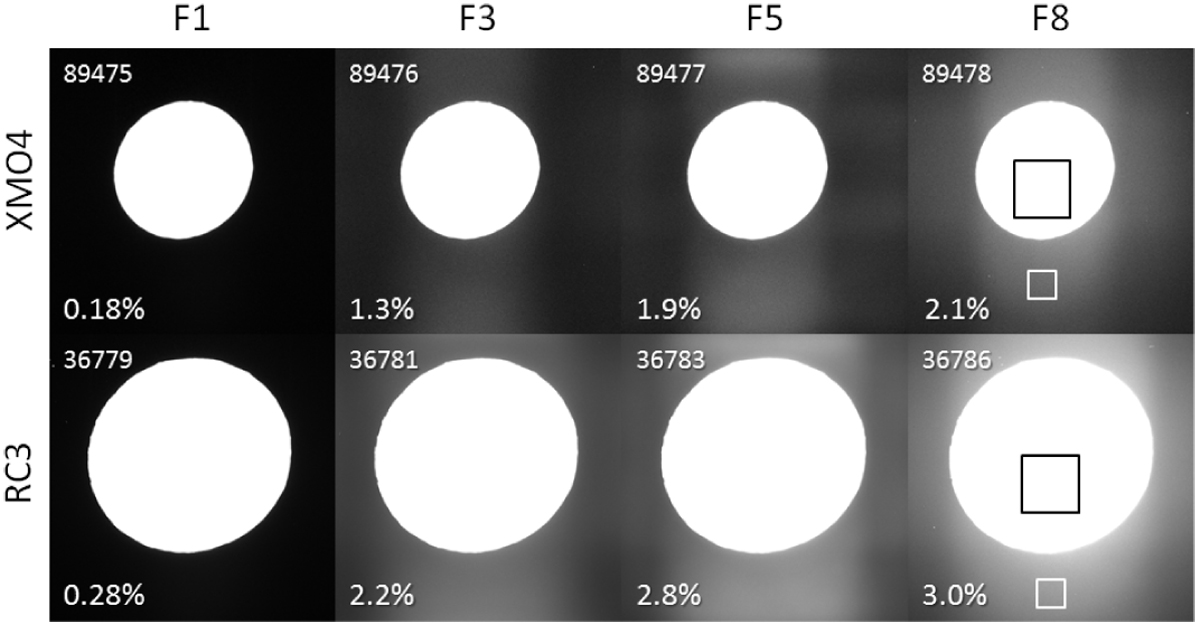
In-field stray light in full-frame FC2 images acquired with different filters (F1–F8) during the RC3 and XMO4 mission phases (image numbers indicated). The percentages refer to how the average signal in the white square compares to that in the black square in each image (for clarity, the squares are only shown for F8). Cerealia Facula is outside the black square. The images are displayed with black being zero signal and white being 5% of the average signal in the black square. The stray light in the RC3 images is about 50% stronger than in the XMO4 images.
Current usage metrics show cumulative count of Article Views (full-text article views including HTML views, PDF and ePub downloads, according to the available data) and Abstracts Views on Vision4Press platform.
Data correspond to usage on the plateform after 2015. The current usage metrics is available 48-96 hours after online publication and is updated daily on week days.
Initial download of the metrics may take a while.