Fig. 2
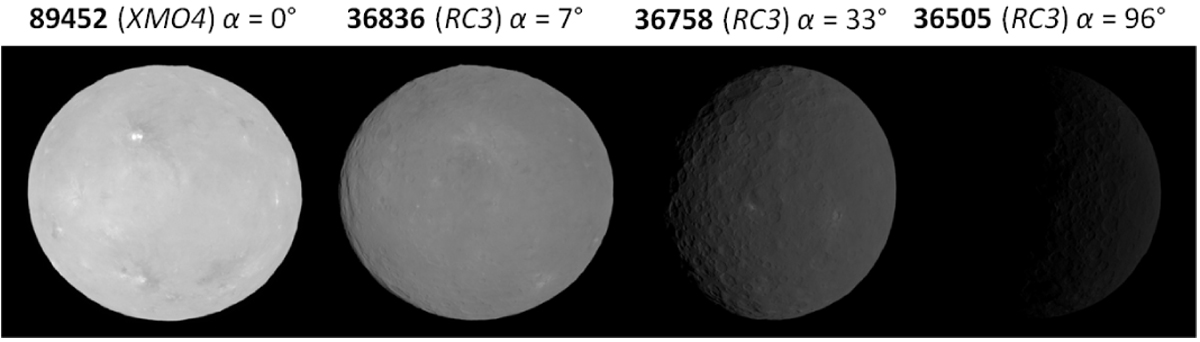
Ceres images representing different parts of the phase curve, shown at their correct relative brightness on a linear scale. The image number, mission phase, and phase angle at the disk center are indicated. Only the Cerealia and Vinalia Faculae (the bright spots in the opposition image at far left) are not displayed at their correct brightness, as they are much brighter than the average Ceres surface (Li et al. 2016; Schröder et al. 2017).
Current usage metrics show cumulative count of Article Views (full-text article views including HTML views, PDF and ePub downloads, according to the available data) and Abstracts Views on Vision4Press platform.
Data correspond to usage on the plateform after 2015. The current usage metrics is available 48-96 hours after online publication and is updated daily on week days.
Initial download of the metrics may take a while.