Fig. 17
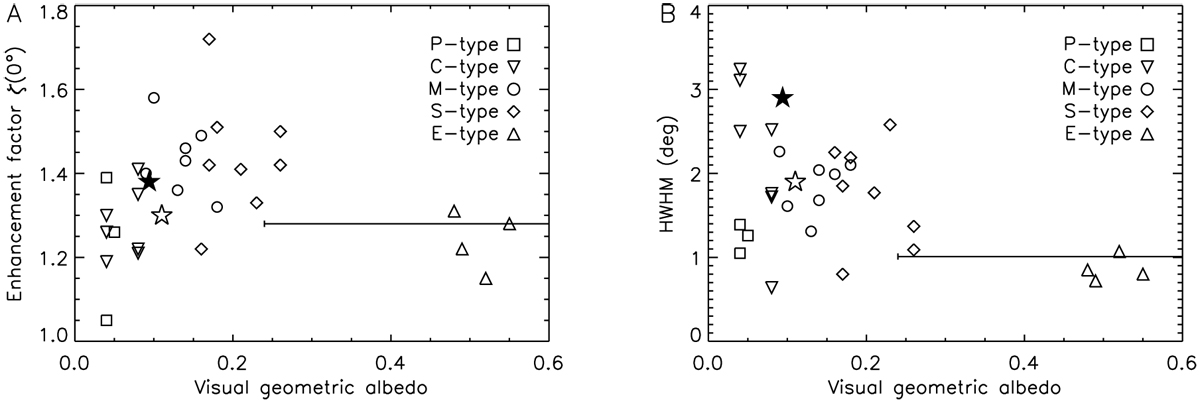
The Ceres OE compared to that of the asteroids in Rosenbush et al. (2002). Panel A: enhancement factor ζ(0°). Panel B: the HWHM. The Ceres values are those for the clear filter in Table 4 (black star) and from Rosenbush et al. (2002; white star). The Cerealia Facula values are located somewhere on the horizontal line. To simplify the plot we included the G type into the C type.
Current usage metrics show cumulative count of Article Views (full-text article views including HTML views, PDF and ePub downloads, according to the available data) and Abstracts Views on Vision4Press platform.
Data correspond to usage on the plateform after 2015. The current usage metrics is available 48-96 hours after online publication and is updated daily on week days.
Initial download of the metrics may take a while.