Fig. 15
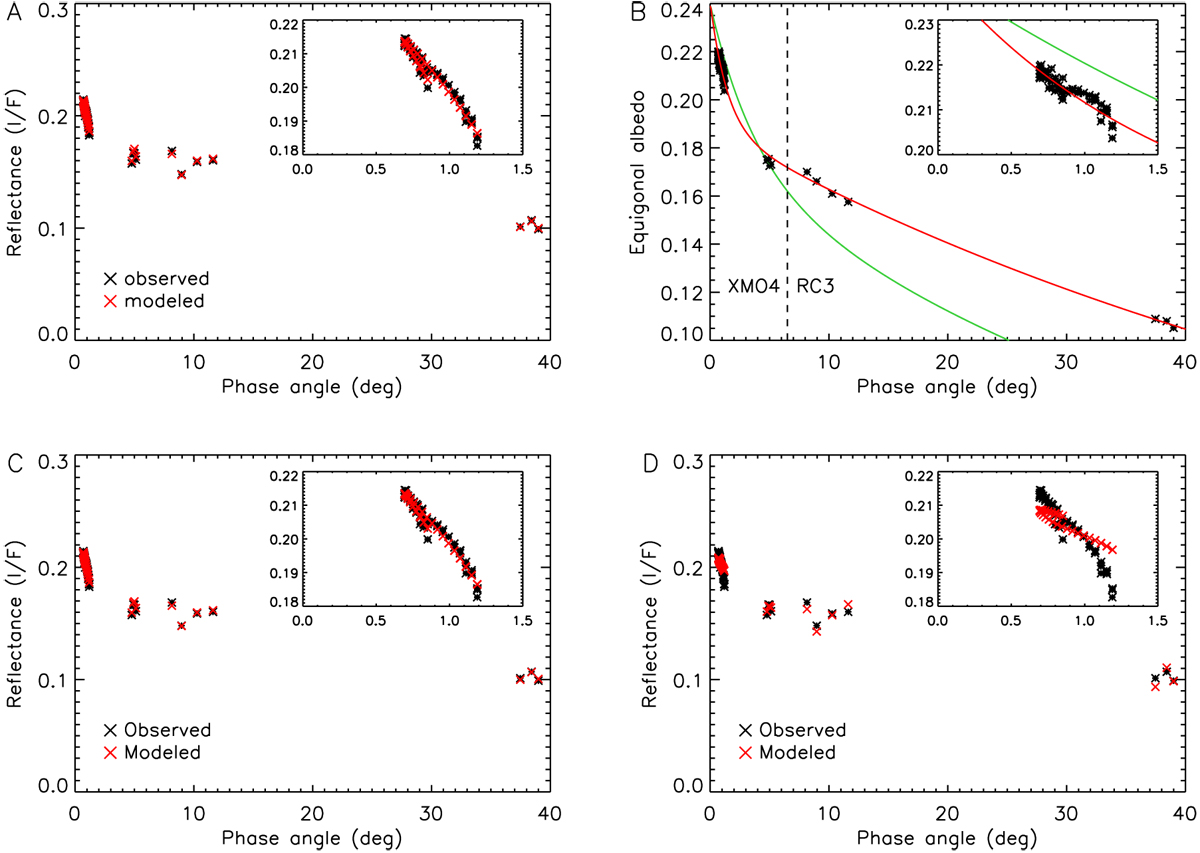
Fitting photometric models to the average reflectance in a 5 × 5 pixel sized box centered on Cerealia Facula in XMO4 and RC3 clear filter images, with ι, ϵ < 70° (n = 69). The insets zooms in on the smallest phase angles. Panel A: Akimov phase function with Lambert/Lommel-Seeliger disk function. Panel B: as panel A, showing the equigonal albedo. The boundary between the two data sets (XMO4 and RC3) is indicated. The best-fit model is drawn in red, while the best-fit model for Ceres average (Fig. 13), scaled to match the former at α = 0°, is drawn in green. Panle C: best-fit Hapke model, which has ![]() . Panel D: best-fit Hapke model for
. Panel D: best-fit Hapke model for ![]() (fixed).
(fixed).
Current usage metrics show cumulative count of Article Views (full-text article views including HTML views, PDF and ePub downloads, according to the available data) and Abstracts Views on Vision4Press platform.
Data correspond to usage on the plateform after 2015. The current usage metrics is available 48-96 hours after online publication and is updated daily on week days.
Initial download of the metrics may take a while.