Fig. 12
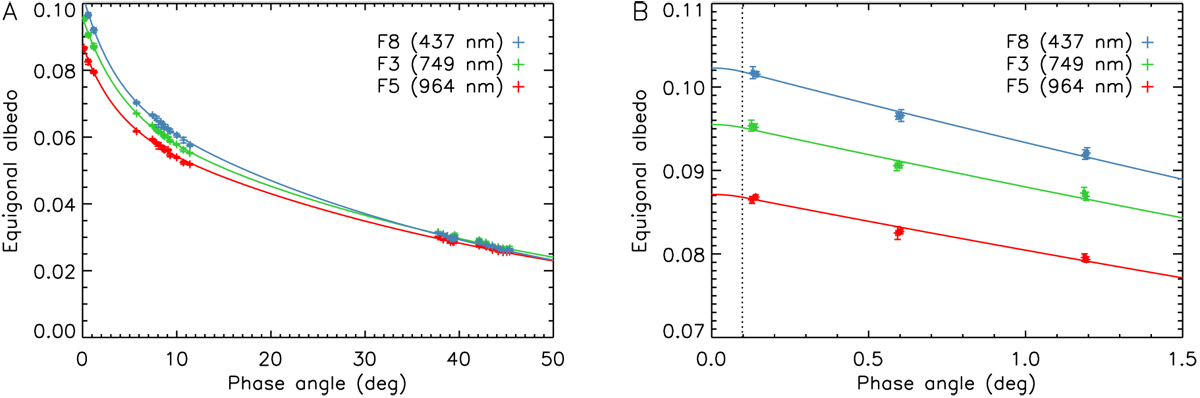
Modeling the narrow-band reflectances, calculated as the average of a box of 3 × 3 pixels centered on the location of the red star in Fig. 4A, with ι, ϵ < 50°. The best-fit model parameters are listed in Table 3. Panel A: Akimov phase function (Eq. (5)). Panel B: exponential phase function (Eq. (5) with m = 0), fitted to α < 1.5°. The model curves account for the finite size of the Sun, with the vertical dotted line indicating the angular radius of the Sun at Ceres.
Current usage metrics show cumulative count of Article Views (full-text article views including HTML views, PDF and ePub downloads, according to the available data) and Abstracts Views on Vision4Press platform.
Data correspond to usage on the plateform after 2015. The current usage metrics is available 48-96 hours after online publication and is updated daily on week days.
Initial download of the metrics may take a while.