Fig. C.1
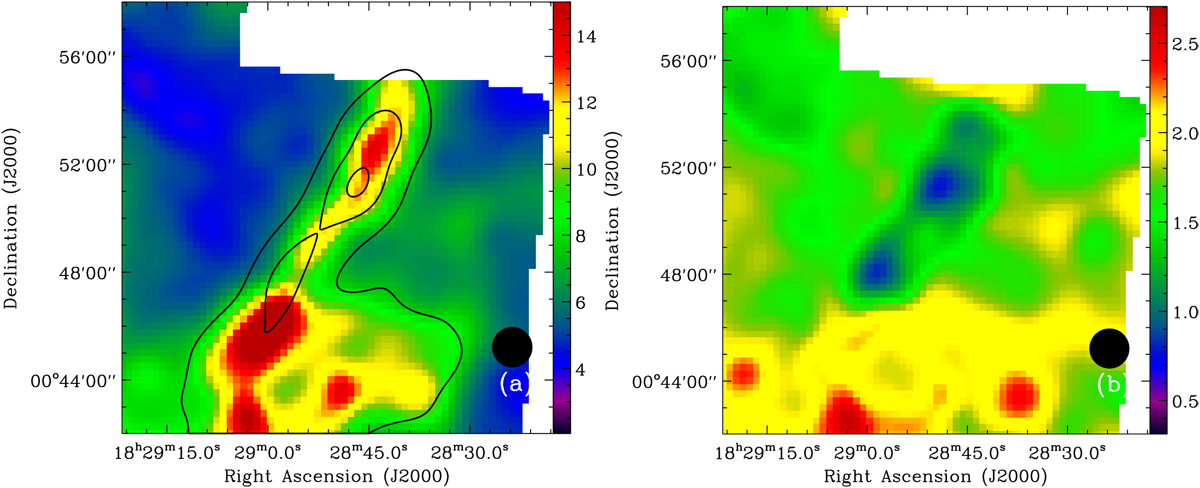
Panel a: Spitzer c2d visual extinction map overlaid with the Herschel H2 column density contours. The contours increase from 4 × 1021 cm−2 to 1.2 × 1022 cm−2 by 4 × 1021 cm−2. The color bar represents the visual extinction in units of magnitude. Panel b: map of the ratios (NH_2,av/![]() ) between the H2 column densities derived from the visual extinction map and those derived from the Herschel SED fitting. The color bar represents the H2 column density ratio. The beam size is shown in the lower right of each panel.
) between the H2 column densities derived from the visual extinction map and those derived from the Herschel SED fitting. The color bar represents the H2 column density ratio. The beam size is shown in the lower right of each panel.
Current usage metrics show cumulative count of Article Views (full-text article views including HTML views, PDF and ePub downloads, according to the available data) and Abstracts Views on Vision4Press platform.
Data correspond to usage on the plateform after 2015. The current usage metrics is available 48-96 hours after online publication and is updated daily on week days.
Initial download of the metrics may take a while.