Fig. 7.
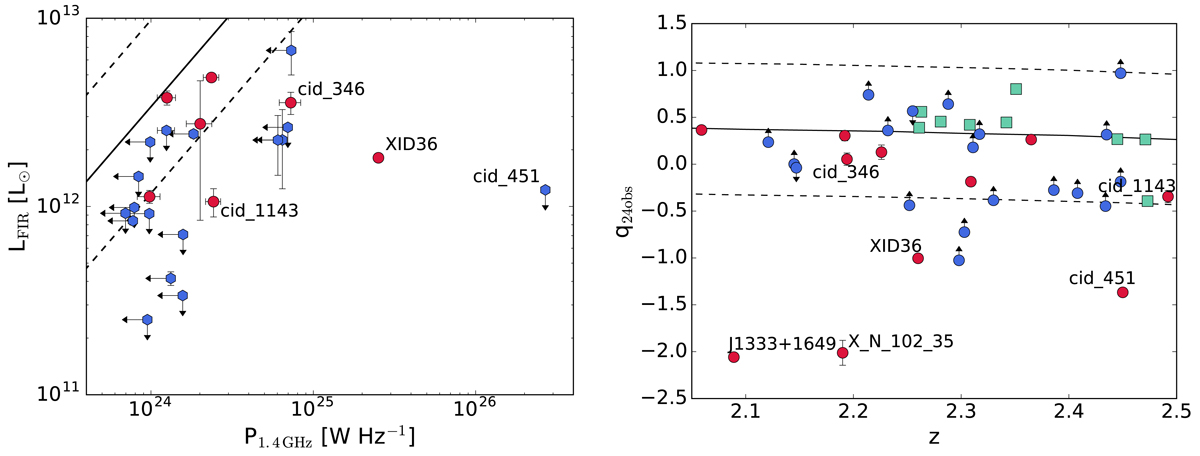
Radio properties of the target sample. Left panel: FIR luminosities due to star formation versus radio power at 1.4 GHz. The solid line shows the Kennicutt (1998a) relation, given by logP1.4 GHz = logLFIR + 11.47, while the dashed lines represent its 2σ dispersion. Red circles depict targets with radio detections, while blue hexagons mark targets with upper limits in the radio regime and/or in the FIR. The four AGN outside the 2σ dispersion and classified as jetted are marked by their ID. Right panel: q24 obs = log(S24 μm/Sr) plotted as a function of redshift for the whole AGN sample. Red dots mark targets with detections both in the MIR and radio regime; blue-dot upper and lower limits represent sources with detections only in the radio or in the MIR, respectively; green squares depict AGN with upper limits both in the MIR and in the radio. The solid line displays q24 obs versus redshift for M82 (from Bonzini et al. 2013), while dashed lines mark the ±2σ dispersion. The six AGN classified as jetted, either from this plot of from the left panel of the figure, are marked by their ID.
Current usage metrics show cumulative count of Article Views (full-text article views including HTML views, PDF and ePub downloads, according to the available data) and Abstracts Views on Vision4Press platform.
Data correspond to usage on the plateform after 2015. The current usage metrics is available 48-96 hours after online publication and is updated daily on week days.
Initial download of the metrics may take a while.