Fig. 6.
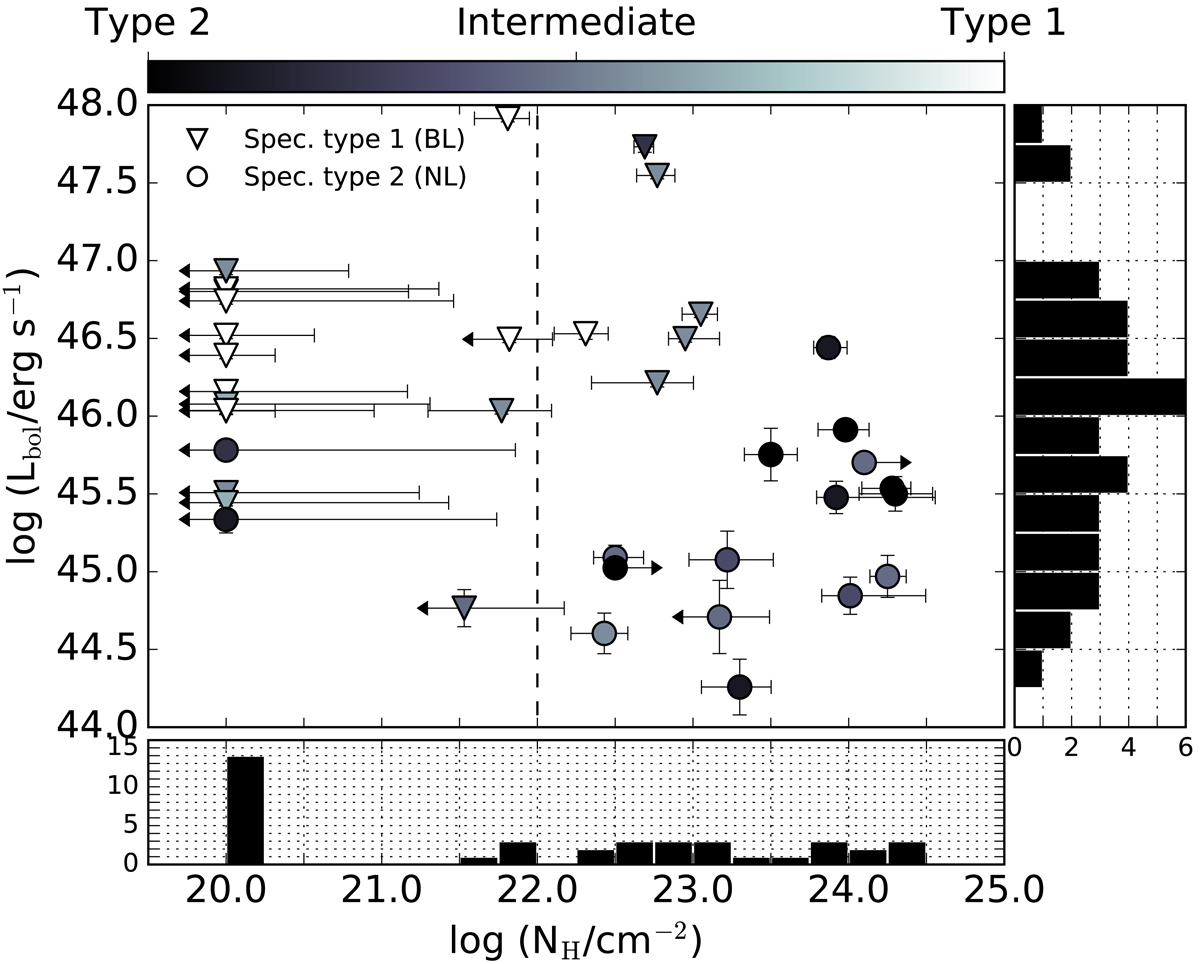
AGN bolometric luminosities versus column densities of the whole target sample. These quantities are derived through SED-fitting modeling and X-ray spectral analysis, respectively. The dashed line at ![]() marks the assumed separation between X-ray unobscured and obscured AGN. The black histograms show the projected distribution of the two quantities along each axis. The gray color scale depicts the inclination of the observer’s line of sight with respect to the dusty torus equatorial plane derived from the SED-fitting analysis, which corresponds to type 2 for dark colors, type 1 for light colors and intermediate (i.e., the transition between the two classes of AGN) in between. The AGN type as derived from the optical spectra is depicted by the different symbols, triangles for type 1s and circles for type 2s. The comparison of the color coding and the different symbols to the location of the targets in the Lbol − NH plane suggests an agreement between the three classification methods and provides extra confidence in the SED-fitting results. The sample results to be almost equally divided in type 1 and type 2 AGN.
marks the assumed separation between X-ray unobscured and obscured AGN. The black histograms show the projected distribution of the two quantities along each axis. The gray color scale depicts the inclination of the observer’s line of sight with respect to the dusty torus equatorial plane derived from the SED-fitting analysis, which corresponds to type 2 for dark colors, type 1 for light colors and intermediate (i.e., the transition between the two classes of AGN) in between. The AGN type as derived from the optical spectra is depicted by the different symbols, triangles for type 1s and circles for type 2s. The comparison of the color coding and the different symbols to the location of the targets in the Lbol − NH plane suggests an agreement between the three classification methods and provides extra confidence in the SED-fitting results. The sample results to be almost equally divided in type 1 and type 2 AGN.
Current usage metrics show cumulative count of Article Views (full-text article views including HTML views, PDF and ePub downloads, according to the available data) and Abstracts Views on Vision4Press platform.
Data correspond to usage on the plateform after 2015. The current usage metrics is available 48-96 hours after online publication and is updated daily on week days.
Initial download of the metrics may take a while.