Fig. 5.
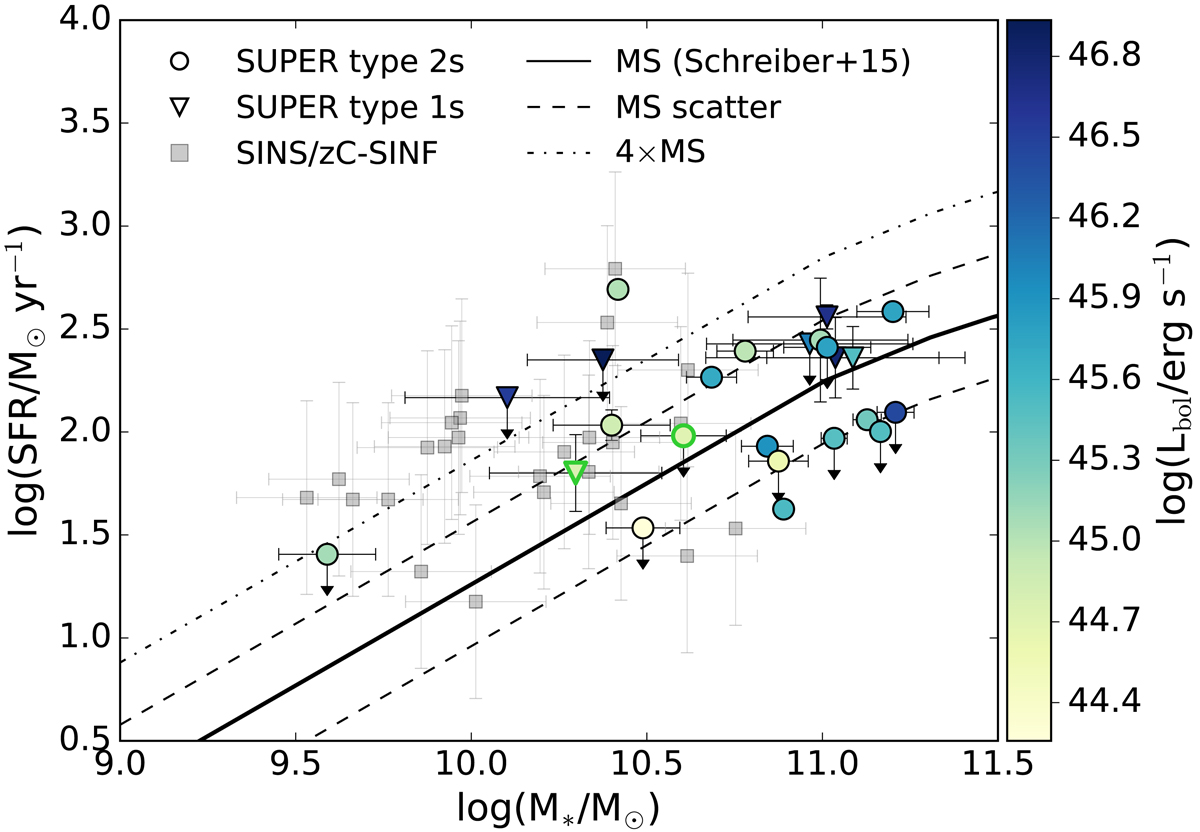
Distribution of host galaxy properties in the SFR-M* plane for the 24 AGN (type 1s marked by triangles and type 2s marked by circles) with star formation constraints in our sample as given in Table A.2. The two data points with green edges represent the targets with SFR derived through modeling of the stellar emission with SED fitting. The color coding indicates the AGN bolometric luminosity for each object of this subsample. The black solid line reproduces the main sequence (MS) of star-forming galaxies from Schreiber et al. (2015) at the average redshift of our target sample (i.e. ∼2.3). The dashed lines mark the scatter of the main sequence (equal to 0.3 dex) while the dot-dashed line represents the locus 4 times above the main sequence along the SFR axis (as defined by Rodighiero et al. 2011). The gray squares trace the properties of the 25 star-forming galaxies targeted by the SINS/zC-SINF survey (Förster Schreiber et al. 2018) without AGN signatures. We note that their selection based on a minimum SFR or Hα flux results in a preferentially higher sSFRs than the overall population of normal galaxies at those redshifts (see discussion in Förster Schreiber et al. 2009; Mancini et al. 2011). These galaxies, with IFS data comparable to the SUPER ones, will be our non-AGN comparison sample in future analyses (see text for more details).
Current usage metrics show cumulative count of Article Views (full-text article views including HTML views, PDF and ePub downloads, according to the available data) and Abstracts Views on Vision4Press platform.
Data correspond to usage on the plateform after 2015. The current usage metrics is available 48-96 hours after online publication and is updated daily on week days.
Initial download of the metrics may take a while.