Fig. 4.
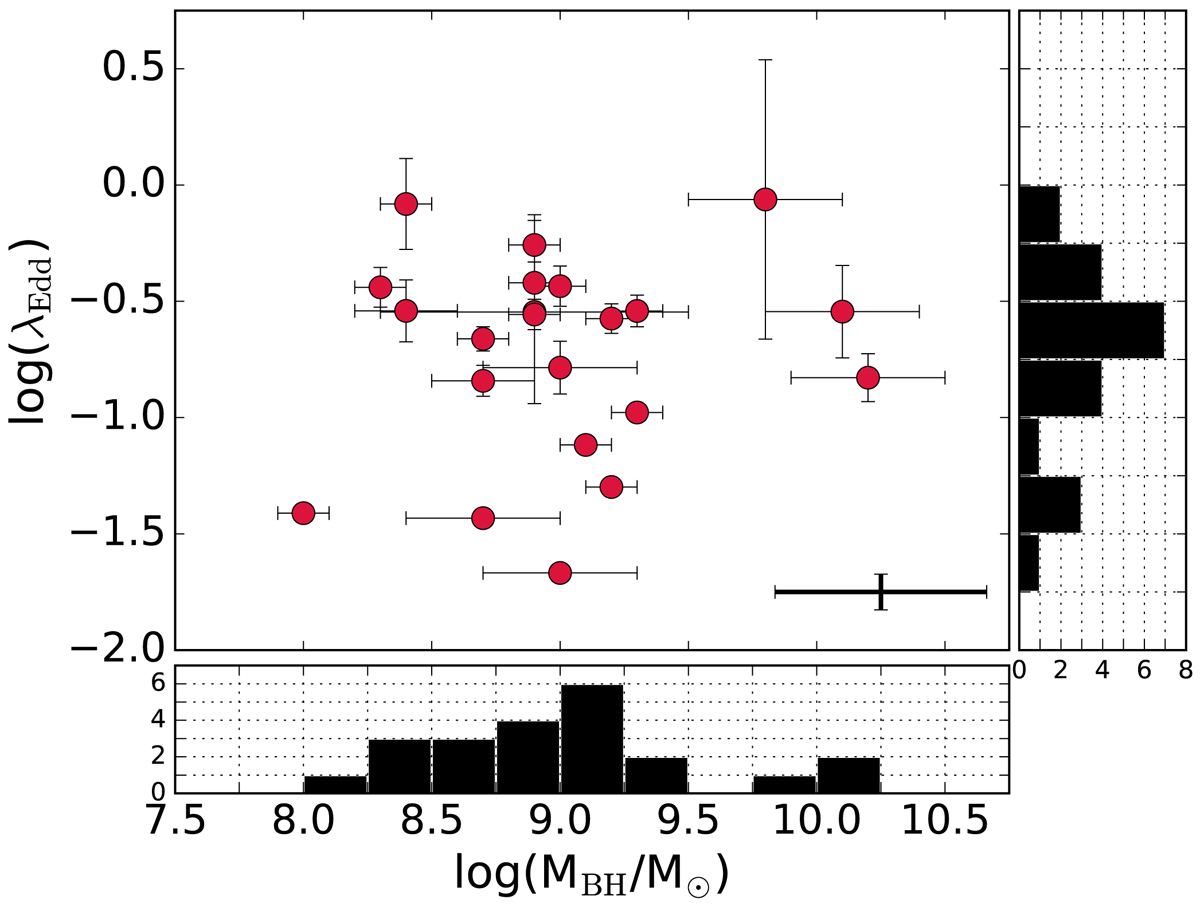
Eddington ratios versus BH masses of the 22 type 1 AGN in the target sample. The Eddington ratio is given by λEdd = Lbol/LEdd, with bolometric luminosities estimated through SED-fitting analysis. BH masses (given in Table A.2) are derived via the “virial method” mainly using the broad C IV emission line and the calibration of Vestergaard & Peterson (2006). We plot a representative error bar at the bottom-right corner of the plot which takes into account a systematic error of 0.4 dex on MBH. The black histograms show the projected distribution of the two quantities along each axis. SUPER will allow us to sample both accretion rates close to the Eddington limit and more moderate ones and to connect these quantities to the potential outflows detected by SINFONI.
Current usage metrics show cumulative count of Article Views (full-text article views including HTML views, PDF and ePub downloads, according to the available data) and Abstracts Views on Vision4Press platform.
Data correspond to usage on the plateform after 2015. The current usage metrics is available 48-96 hours after online publication and is updated daily on week days.
Initial download of the metrics may take a while.