Fig. 3.
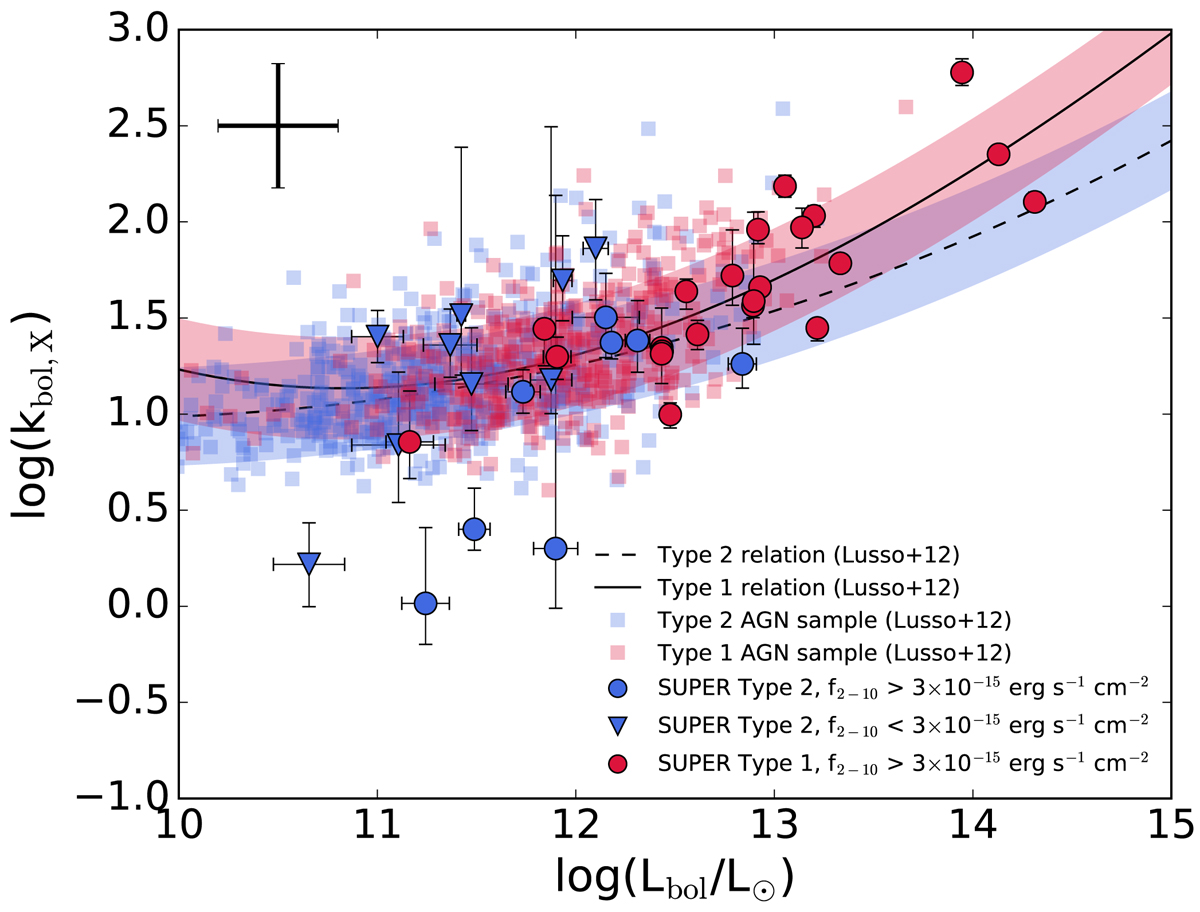
Bolometric corrections in the hard 2 − 10 keV band versus bolometric luminosities. Circles and triangles mark the SUPER targets with 2 − 10 keV fluxes higher and lower than 3 × 10⁻¹⁵ erg s−1 cm−2 respectively, while type 1 and type 2 AGN are plotted in red and blue. The solid and dashed lines show the relations obtained by Lusso et al. (2012) for type 1s and type 2s with fluxes higher than 3 × 10⁻¹⁵ erg s−1 cm−2, respectively. The shaded areas depict the scatter of these relations. We plot as red and blue squares the sample of type 1 and type 2 AGN, respectively, analyzed by Lusso et al. (2012) to show the dispersion of the data around the best-fit relations. The error bar in the upper-left corner takes into account a systematic error of 0.3 dex on Lbol. The SUPER data points are well consistent with the trends found for the bolometric correction.
Current usage metrics show cumulative count of Article Views (full-text article views including HTML views, PDF and ePub downloads, according to the available data) and Abstracts Views on Vision4Press platform.
Data correspond to usage on the plateform after 2015. The current usage metrics is available 48-96 hours after online publication and is updated daily on week days.
Initial download of the metrics may take a while.