Fig. 1.
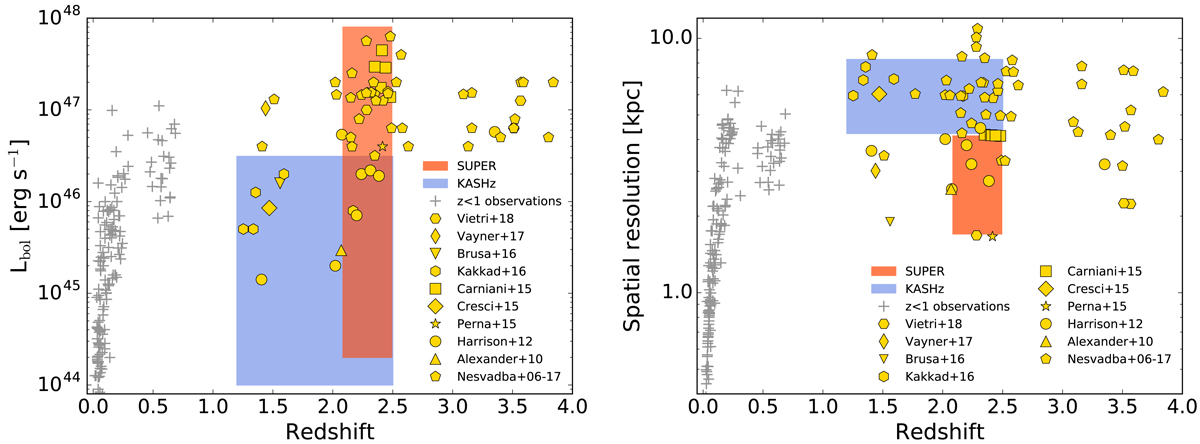
Summary of IFS observations from the literature characterizing ionized outflows through the [O III]λ5007 emission line in AGN host galaxies. Left panel: for each observation we plot the AGN bolometric luminosity of the source, in units of erg s−1, as a function of redshift. The red and blue shaded areas show the parameter space probed by SUPER and KASHz (Harrison et al. 2016; Harrison et al., in prep.), respectively. Excluding these two surveys, current observations at z > 1 are limited to a smaller number of objects, mainly at high luminosity (Lbol > 1046 erg s−1) and focused on targets mostly selected to increase the chances to detect an outflow. SUPER will be able to explore a wide range in bolometric luminosities (1044 < Lbol < 1048 erg s−1) for an unbiased sample of AGN. The gray crosses represent observations at z < 1 (Bae et al. 2017; Rupke et al. 2017; Karouzos et al. 2016; Harrison et al. 2014; Husemann et al. 2013, 2014, 2017b; Liu et al. 2013, 2014) covering the parameter space much more uniformly than high-redshift observations available so far (Vietri et al. 2018; Vayner et al. 2017; Brusa et al. 2016; Kakkad et al. 2016; Carniani et al. 2015; Cresci et al. 2015; Perna et al. 2015; Harrison et al. 2012; Alexander et al. 2010; Nesvadba et al. 2006, 2007, 2008, 2011, 2017a,b). All AGN bolometric luminosities, when not available in the papers, have been obtained consistently either as indicated in the papers themselves or from the observed [O III] luminosity adopting a conversion factor of 3500 (Heckman et al. 2004). Right panel: Spatial resolution, in kpc, of the observations shown in the left panel as a function of redshift. The angular resolutions from which the values plotted are derived, are taken from the respective papers and given by the seeing of the observations or from the size of the PSF. SUPER observations will allow us to reach an unprecedented spatial resolution (i.e. ∼1.7 − 4 kpc) for a sizeable sample of 39 AGN, obtained just by a few single-object studies so far at similar redshift.
Current usage metrics show cumulative count of Article Views (full-text article views including HTML views, PDF and ePub downloads, according to the available data) and Abstracts Views on Vision4Press platform.
Data correspond to usage on the plateform after 2015. The current usage metrics is available 48-96 hours after online publication and is updated daily on week days.
Initial download of the metrics may take a while.