Fig. 6
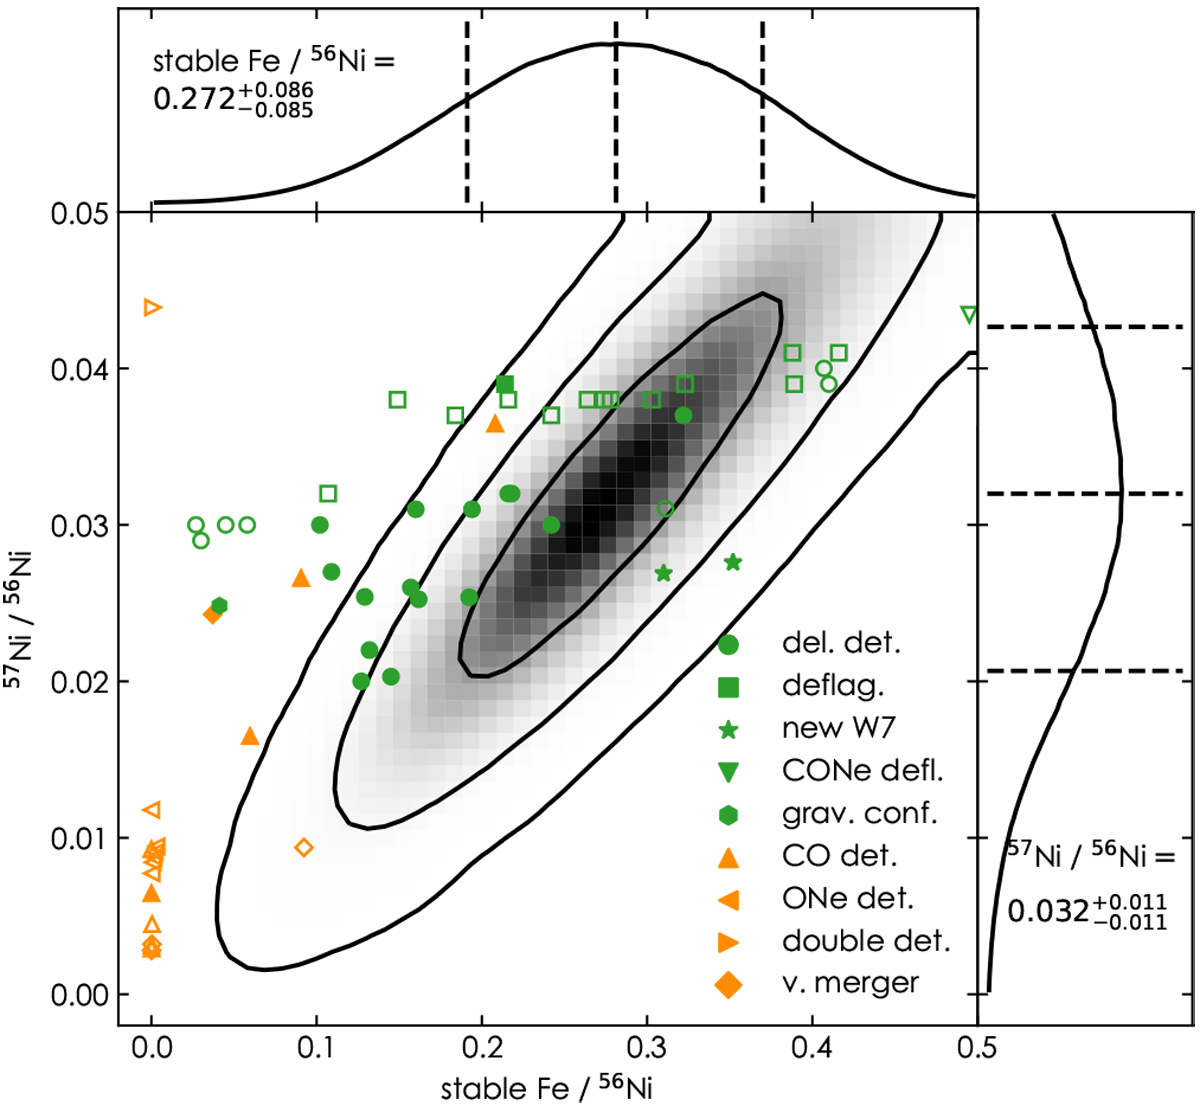
Covariances and normalized posterior densities of model M3. Theoretical predictions of the initial 54,56Fe and 57Ni fraction of various explosion models are indicated by green (Near-Ch-mass) and orange (sub-Ch-mass) symbols. Theoretical predictions with too little (<0.4 M⊙) or too much (>0.8 M⊙) 56Ni compared to Branch-normal SNe Ia are marked as empty symbols. Black lines show the 1, 2, and 3σ credibility regions. Numbers next to the 1D histograms indicate the 68% credibilityrange of the individual parameters. Models: Del. Det. (Seitenzahl et al. 2013; Ohlmann et al. 2014; Nomoto & Leung 2018), Deflag. (Fink et al. 2014), new W7 (Nomoto & Leung 2018), CONe Defl. (Kromer et al. 2015), Grav. Conf. (Seitenzahl et al. 2016), CO Det. (Sim et al. 2010; Nomoto & Leung 2018), ONe Det. (Marquardt et al. 2015), Double Det. (Sim et al. 2012), V. Merger (Pakmor et al. 2010, 2012; Kromer et al. 2013, 2016).
Current usage metrics show cumulative count of Article Views (full-text article views including HTML views, PDF and ePub downloads, according to the available data) and Abstracts Views on Vision4Press platform.
Data correspond to usage on the plateform after 2015. The current usage metrics is available 48-96 hours after online publication and is updated daily on week days.
Initial download of the metrics may take a while.