Fig. 3
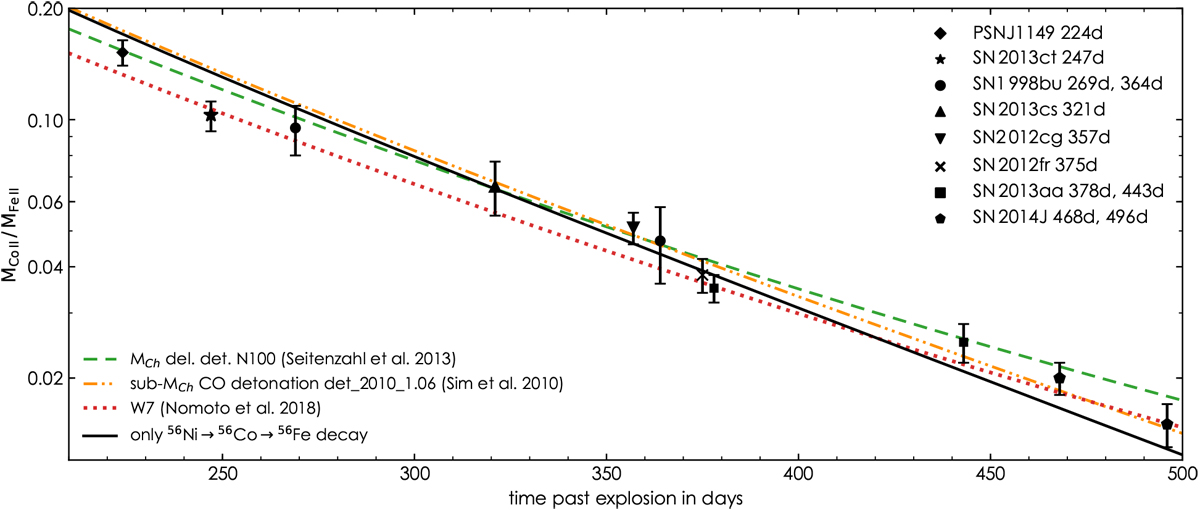
Evolution of the inferred MCo II ∕ MFe II ratio with time. We assumed a rise time of 18 days (Ganeshalingam et al. 2011). The error bars reflect the 68% posterior interval of the mass ratio. The coloured lines show the expected mass ratio MCo ∕ MFe of the MCh delayed-detonation model “N100” (Seitenzahl et al. 2013, green), the sub-MCh CO detonation model “det_2010_1.06” (Sim et al. 2010, orange) and the MCh “W7 Z⊙” model (Nomoto & Leung 2018, red). The black line is not a fit to the data and represents the MCo ∕ MFe ratio assuming only radioactive decay from 56Ni to 56Co to 56Fe. The same ionisation fractions of Co II and Fe II allow us to generalise MCo II ∕ MFe II to MCo ∕ MFe and compare the two ratios (see Sect. 5).
Current usage metrics show cumulative count of Article Views (full-text article views including HTML views, PDF and ePub downloads, according to the available data) and Abstracts Views on Vision4Press platform.
Data correspond to usage on the plateform after 2015. The current usage metrics is available 48-96 hours after online publication and is updated daily on week days.
Initial download of the metrics may take a while.