Fig. 2
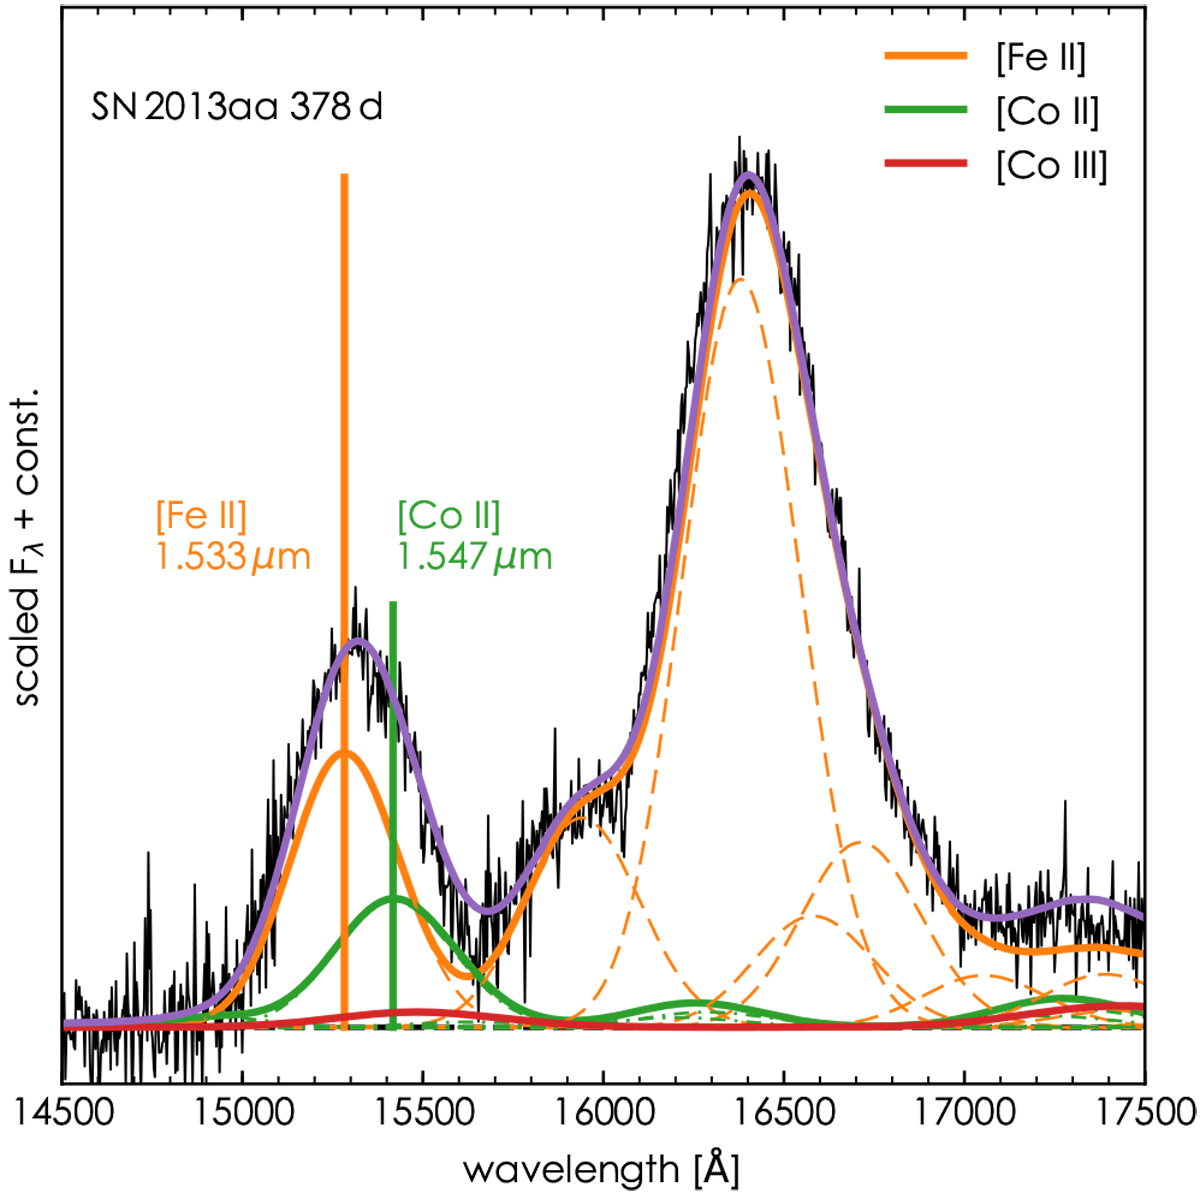
Best fit model of SN 2013aa at 378 d in the H-band. Shown is the extinction and redshift corrected spectrum (black line) and individual contributions from the ions Fe II (orange), Co II (green) and Co III (red) as solid curves. The purple line is the combined emission of the three ions. The two solid vertical lines are used to compute MCo II ∕ MFe II. Dashed curves indicate the contribution of the individual lines in the blended region. We do not show Ni II as it does not have any lines in this region.
Current usage metrics show cumulative count of Article Views (full-text article views including HTML views, PDF and ePub downloads, according to the available data) and Abstracts Views on Vision4Press platform.
Data correspond to usage on the plateform after 2015. The current usage metrics is available 48-96 hours after online publication and is updated daily on week days.
Initial download of the metrics may take a while.