Fig. 1
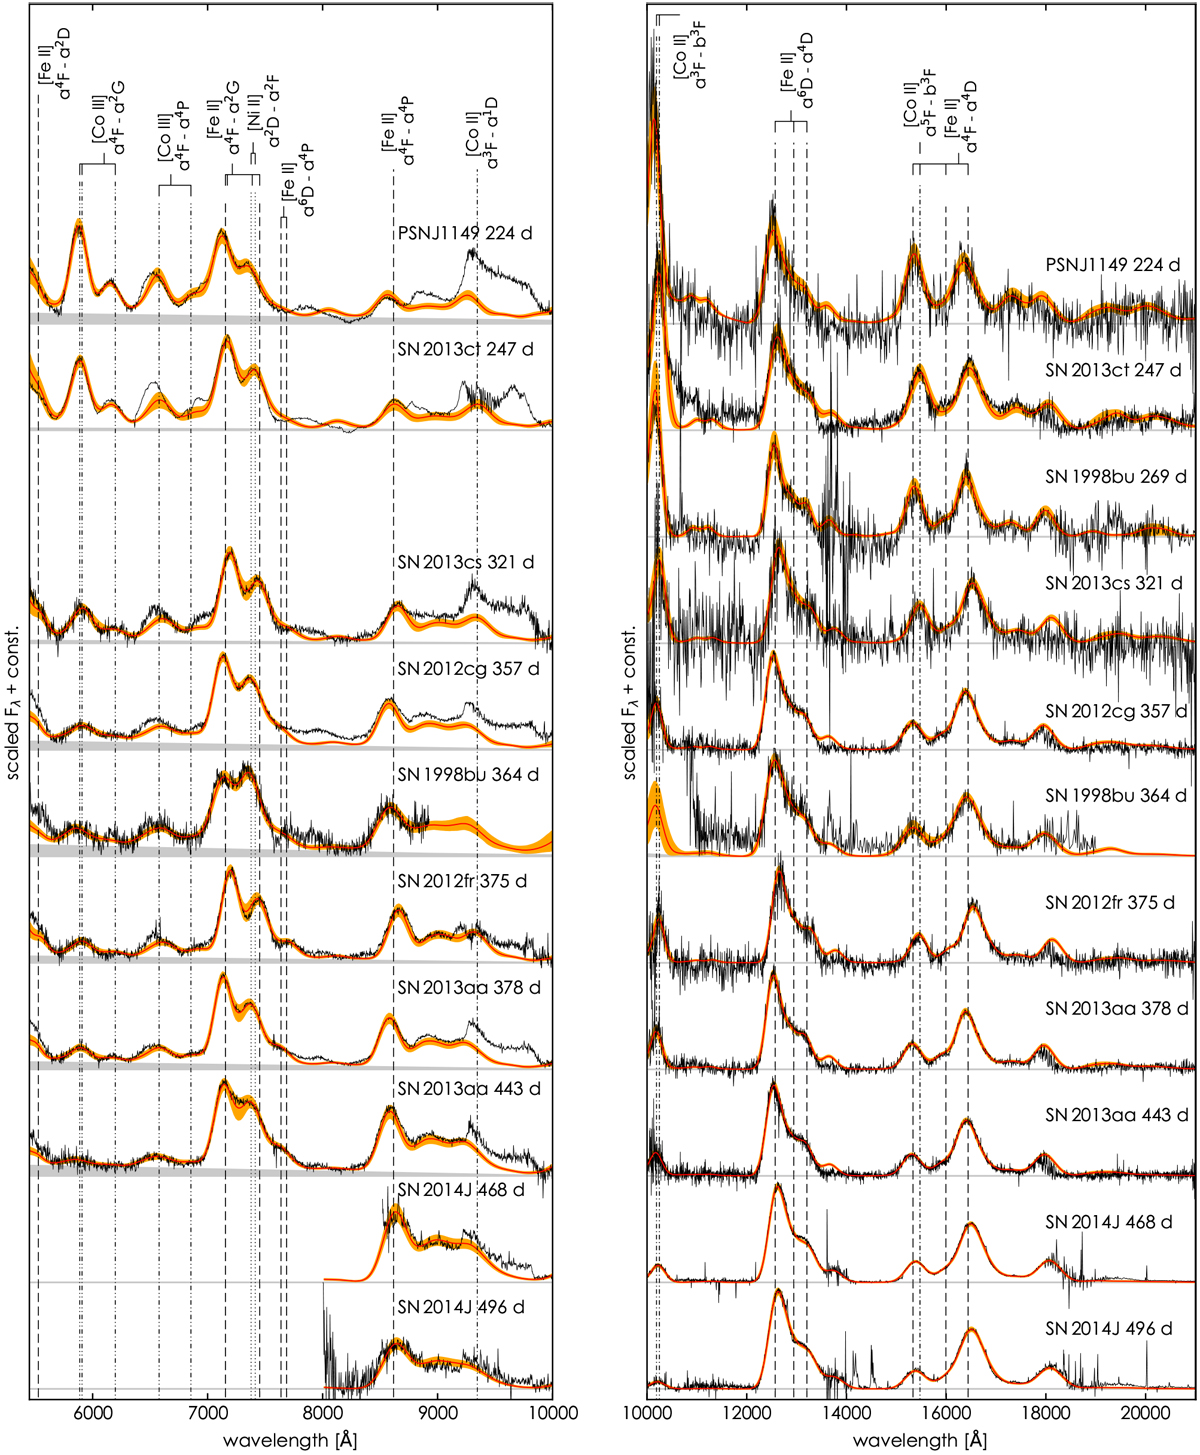
Optical (left panel) and NIR (right panel) spectra of SNe Ia obtained with X-shooter, FORS1, and ISAAC at the VLT, SOFI at the NTT, and GNIRS at Gemini-North. The spectra are arranged in epoch starting with the youngest at the top and corrected for redshift and extinction. Fluxes are normalized to the 7300 Å [Fe II] + [Ni II] feature (optical) and 12 600 Å [Fe II] feature (NIR). The red line indicates the mean flux of all fit models at each wavelength, the orange shaded area marks the 68% uncertainty of the fit. Dashed vertical lines indicate the strongest lines as given in Table 2 ([Fe II]: - - - -, [Ni II]: ⋯ ⋯⋯ [Co II]: —⋅—, [Co III]: — ⋅ ⋅— ⋅). The subtracted background is shown as a grey band. Fits were performed for the optical and NIR spectra at the same time. The lines/ions composing the features below 5500Å are not included in our fits.
Current usage metrics show cumulative count of Article Views (full-text article views including HTML views, PDF and ePub downloads, according to the available data) and Abstracts Views on Vision4Press platform.
Data correspond to usage on the plateform after 2015. The current usage metrics is available 48-96 hours after online publication and is updated daily on week days.
Initial download of the metrics may take a while.