Fig. 7.
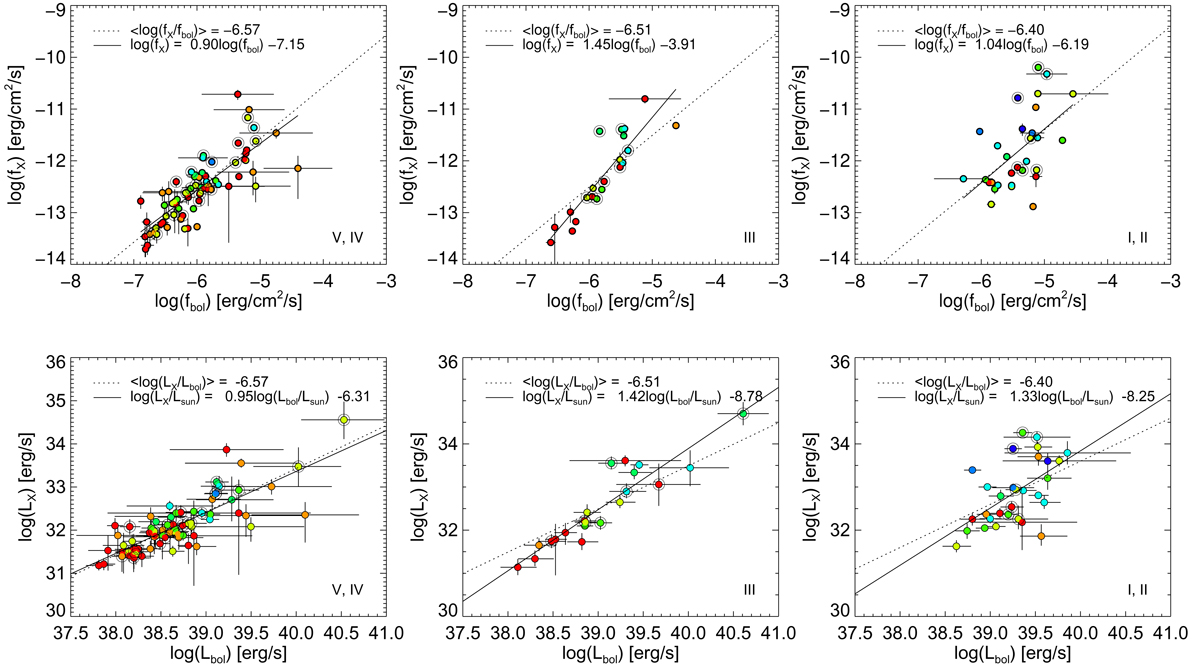
log(fX/fbol) (top row) and log(LX/Lbol) (bottom row) relation for O stars of different luminosity classes (V, III, and I from left to right panels). Known spectroscopic binaries are highlighted with a ring around the solid circle, and spectral types are color coded as in Fig. 5. The linear fits log(fX) = a + b × log(fbol) and the mean log(fX/fbol) values for each case are shown as solid and dotted lines, respectively (see text for details). For O supergiants, the correlations are weak, while they are significant for O dwarf and giant stars (see Table 3).
Current usage metrics show cumulative count of Article Views (full-text article views including HTML views, PDF and ePub downloads, according to the available data) and Abstracts Views on Vision4Press platform.
Data correspond to usage on the plateform after 2015. The current usage metrics is available 48-96 hours after online publication and is updated daily on week days.
Initial download of the metrics may take a while.