Fig. 5.
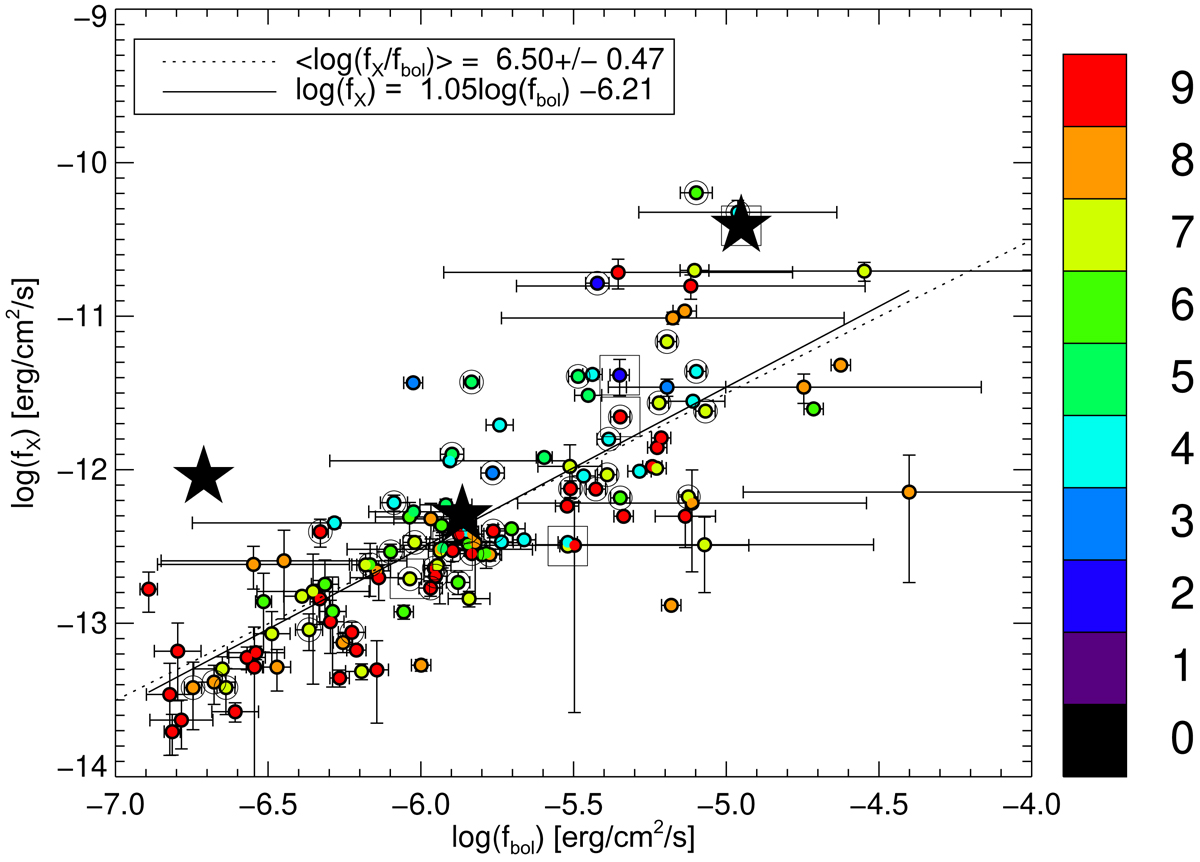
X-ray flux vs. bolometric flux for O stars of all luminosity classes and as a function of the spectral subtype (color-coded with earlier subtypes being bluer, and the later subtypes being redder). Known spectroscopic binaries are highlighted with a ring around the solid circle, magnetic O stars are represented by asterisks, and stars flagged as variable are shown with a squared symbol. The linear fit log(fX) = a + b × log(fbol) and the mean log(fX/fbol) value are shown as solid and dotted lines, respectively (see text for details).
Current usage metrics show cumulative count of Article Views (full-text article views including HTML views, PDF and ePub downloads, according to the available data) and Abstracts Views on Vision4Press platform.
Data correspond to usage on the plateform after 2015. The current usage metrics is available 48-96 hours after online publication and is updated daily on week days.
Initial download of the metrics may take a while.