Fig. 11.
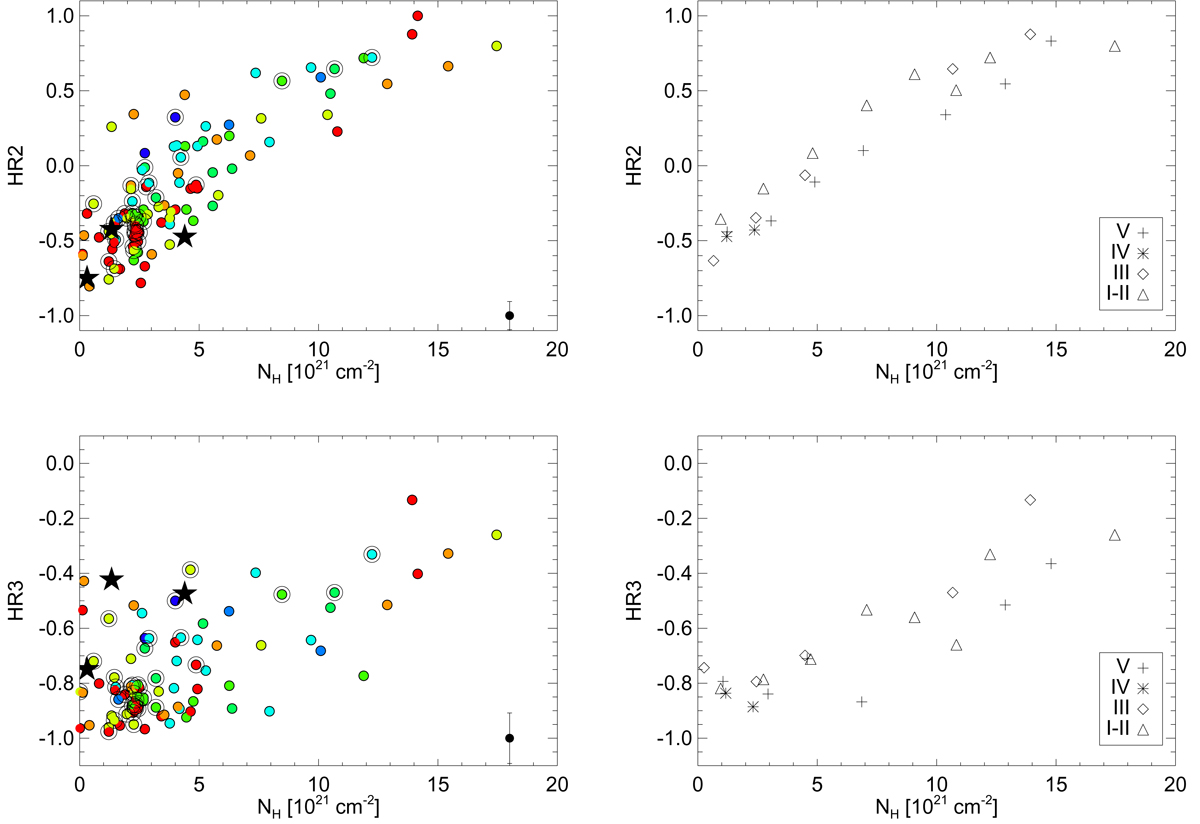
Hardness ratios HR2 (top panels) and HR3 (bottom panels) as a function of NH. In the left panels symbols have been colored according to the spectral type as in Fig. 5 and mean error in the HR is indicated in the lower right corner of the plot. In the right panels, mean HRs have been calculated per bin of NH and different luminosity classes; different symbols stand for different luminosity classes as indicated in the legend.
Current usage metrics show cumulative count of Article Views (full-text article views including HTML views, PDF and ePub downloads, according to the available data) and Abstracts Views on Vision4Press platform.
Data correspond to usage on the plateform after 2015. The current usage metrics is available 48-96 hours after online publication and is updated daily on week days.
Initial download of the metrics may take a while.