Fig. 8
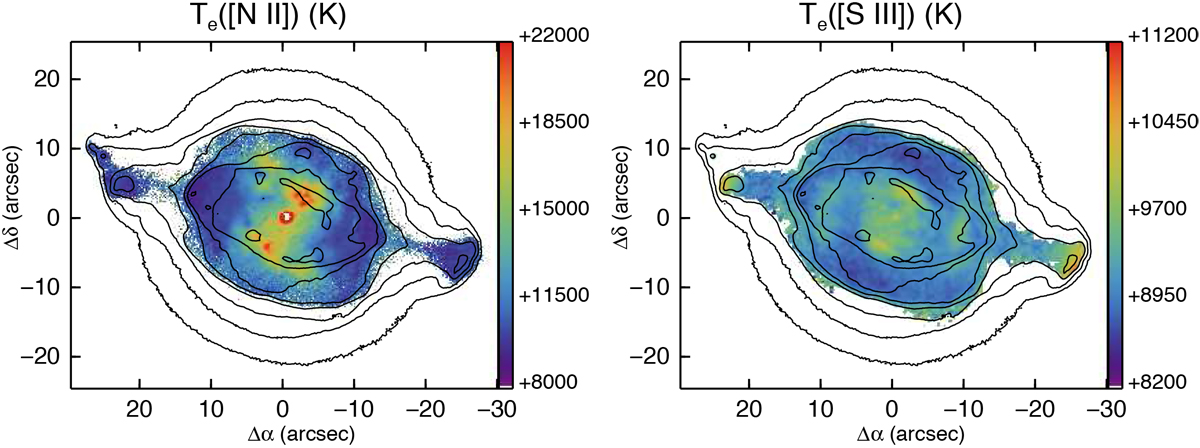
Maps of Te determined from [N II] (left panel) and [S III] (right panel). The elevated values in the central region for the [N II] Te are assumed to be caused by the contribution of N++ recombination to the [N II]5754.6 Å line; see text for a consideration. The log F(H β) surface brightness contours are as in Fig. 7. The simple means on the signal-to-error value over the two Te maps are 52and 21, respectively.
Current usage metrics show cumulative count of Article Views (full-text article views including HTML views, PDF and ePub downloads, according to the available data) and Abstracts Views on Vision4Press platform.
Data correspond to usage on the plateform after 2015. The current usage metrics is available 48-96 hours after online publication and is updated daily on week days.
Initial download of the metrics may take a while.