Fig. 7
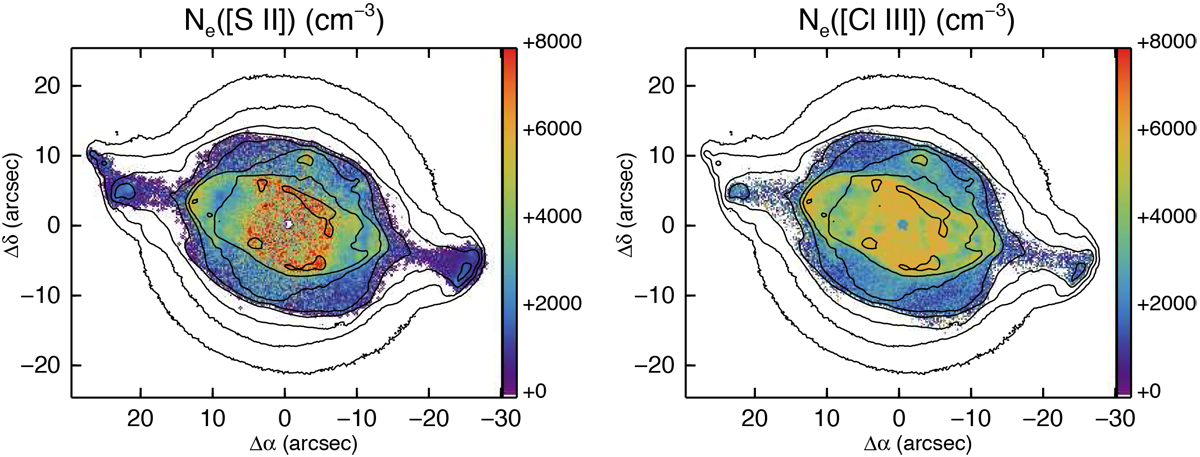
Maps of Ne determinedfrom [S II] (left panel) and [Cl III] (right panel). The contours correspond to the observed log F(H β) image shownin Fig. 3 (left panel), with contours set at log10 F(H β) surface brightness (ergs cm−2 s−1 arcsec−2) from −15.0 to −11.8 in steps of +0.4. The electrondensities for collisional de-excitation of the [S II] and [Cl III] 2D3∕2 levels for these diagnostics are 3.1 × 10³ and 2.4 × 104 cm−3 at 104 K, respectively. The simple means on the signal-to-error value over the two Ne maps are 6 and 4, respectively.
Current usage metrics show cumulative count of Article Views (full-text article views including HTML views, PDF and ePub downloads, according to the available data) and Abstracts Views on Vision4Press platform.
Data correspond to usage on the plateform after 2015. The current usage metrics is available 48-96 hours after online publication and is updated daily on week days.
Initial download of the metrics may take a while.