Fig. 5
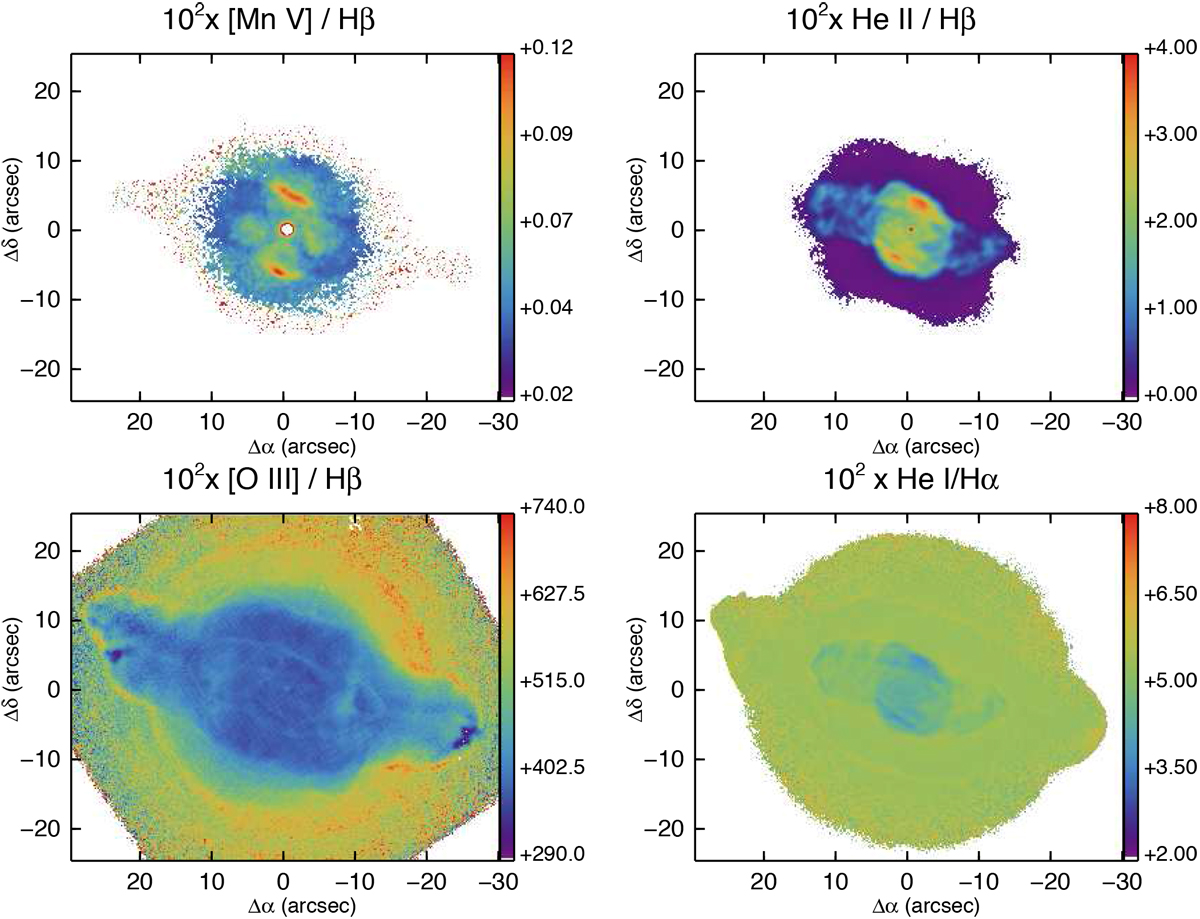
Simple observed emission line ratio images (linear scale, × 100) with respect to an H line for NGC 7009, ordered by decreasing ionization potential of the nominator image: [Mn V]6393.5Å/Hβ; He II 5411.5 Å/Hβ; [O III]4958.9 Å/Hβ; He I 5875.6 Å/Hα; [O II]7330.2 Å/Hα; [N II]6583.5 Å/Hα; [S II]6730.8 Å/Hα and [O I]6300.3 Å/Hα. The 3× 3-σ clipped means on the signal-to-error above 3× the error on the ratio are: 8, 35, 47, 60, 26, 41, 34 and 29, respectively.
Current usage metrics show cumulative count of Article Views (full-text article views including HTML views, PDF and ePub downloads, according to the available data) and Abstracts Views on Vision4Press platform.
Data correspond to usage on the plateform after 2015. The current usage metrics is available 48-96 hours after online publication and is updated daily on week days.
Initial download of the metrics may take a while.