Fig. 21
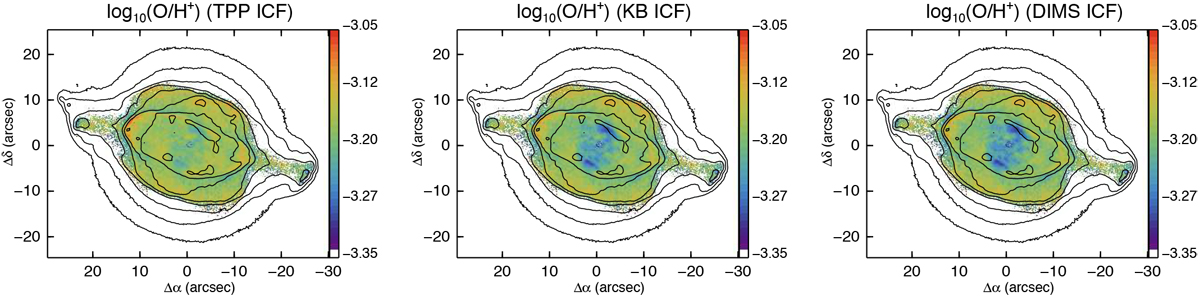
Maps of total O/H+ abundance for three ionization correction factors adjusting for the presence of O+++. Left: the ’classical’ scheme of Torres-Peimbert & Peimbert (1977); centre: the corrected classical ICF advocated by Kingsburgh & Barlow (1994); right: the model-based approach of Delgado-Inglada et al. (2014). The log F(Hβ) surface brightness contours are as in Fig. 7.
Current usage metrics show cumulative count of Article Views (full-text article views including HTML views, PDF and ePub downloads, according to the available data) and Abstracts Views on Vision4Press platform.
Data correspond to usage on the plateform after 2015. The current usage metrics is available 48-96 hours after online publication and is updated daily on week days.
Initial download of the metrics may take a while.