Free Access
Fig. 18
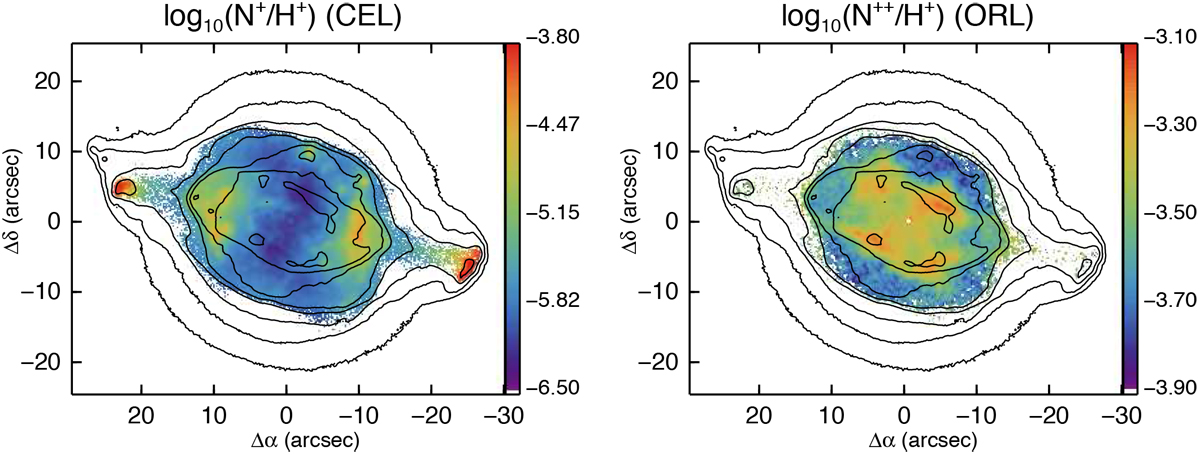
Map of N+/H+ from the CEL [N II] lines (left panel) and for N++/H+ from the N ii5679.6 Å ORL line (right panel). The log F(Hβ) surface brightness contours are as in Fig. 7. The mean values of signal-to-error are 15 and 5, respectively.
Current usage metrics show cumulative count of Article Views (full-text article views including HTML views, PDF and ePub downloads, according to the available data) and Abstracts Views on Vision4Press platform.
Data correspond to usage on the plateform after 2015. The current usage metrics is available 48-96 hours after online publication and is updated daily on week days.
Initial download of the metrics may take a while.