Free Access
Fig. 13
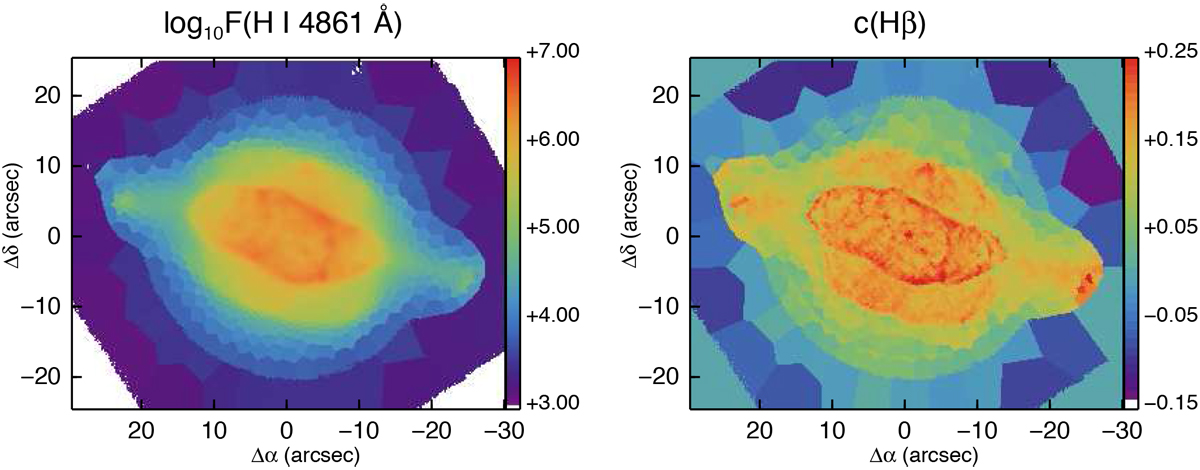
Left panel: Voronoi tesselated version of the 120 s Hβ emission line image, in a log display showing the adaptive bins. Right panel: extinction map, c(Hβ), for the Voronoi tesselated images based on the ratio of the 120 s Hβ image and the 10 s Hα images.
Current usage metrics show cumulative count of Article Views (full-text article views including HTML views, PDF and ePub downloads, according to the available data) and Abstracts Views on Vision4Press platform.
Data correspond to usage on the plateform after 2015. The current usage metrics is available 48-96 hours after online publication and is updated daily on week days.
Initial download of the metrics may take a while.