Free Access
Fig. 12
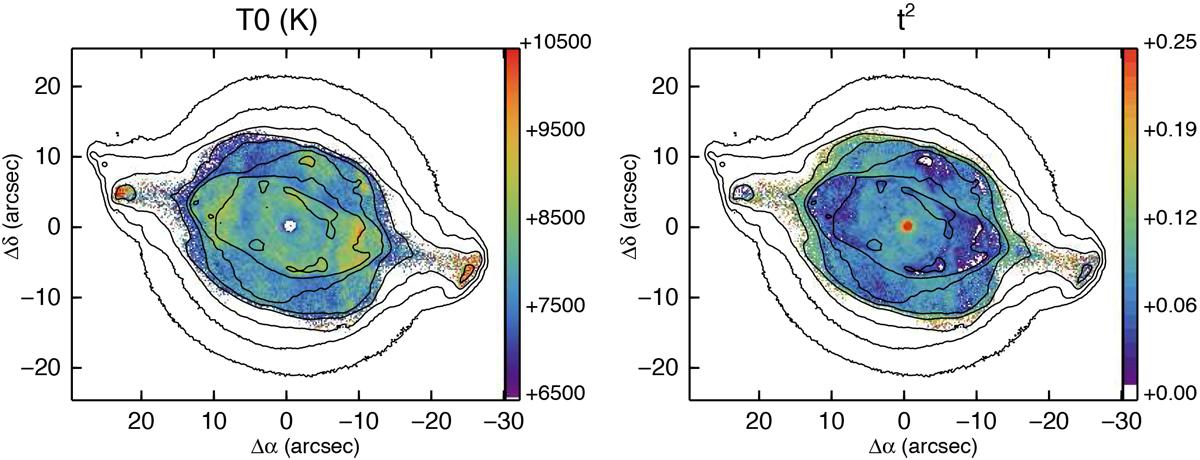
Maps of the average temperature (T0, left panel) and the temperature fluctuation parameter (t2, right panel) determined from the [S III] and the Paschen Jump Te maps. The log F(Hβ) surface brightness contours are as in Fig. 7. The mean signal-to-error over the T0 map is 45 and for the t2 map is 15.
Current usage metrics show cumulative count of Article Views (full-text article views including HTML views, PDF and ePub downloads, according to the available data) and Abstracts Views on Vision4Press platform.
Data correspond to usage on the plateform after 2015. The current usage metrics is available 48-96 hours after online publication and is updated daily on week days.
Initial download of the metrics may take a while.