Free Access
Fig. 11
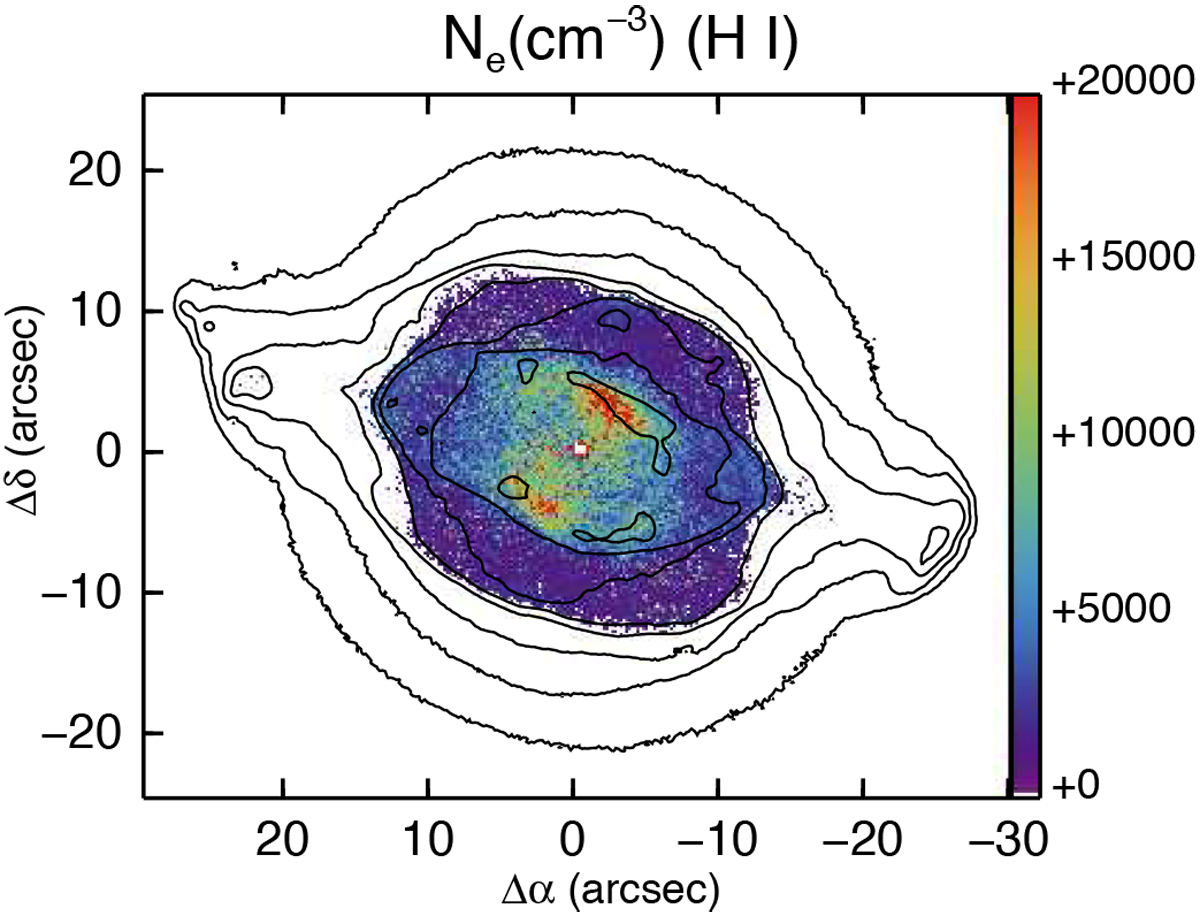
Map of Ne derived by comparing the strengths of the higher Paschen lines (P15 – P26) with the Case B predictions, adopting Te values provided by the [S III] ratio. The log F(Hβ) surface brightness contours are as in Fig. 7. The mean signal-to-error is 2.
Current usage metrics show cumulative count of Article Views (full-text article views including HTML views, PDF and ePub downloads, according to the available data) and Abstracts Views on Vision4Press platform.
Data correspond to usage on the plateform after 2015. The current usage metrics is available 48-96 hours after online publication and is updated daily on week days.
Initial download of the metrics may take a while.