Fig. 10
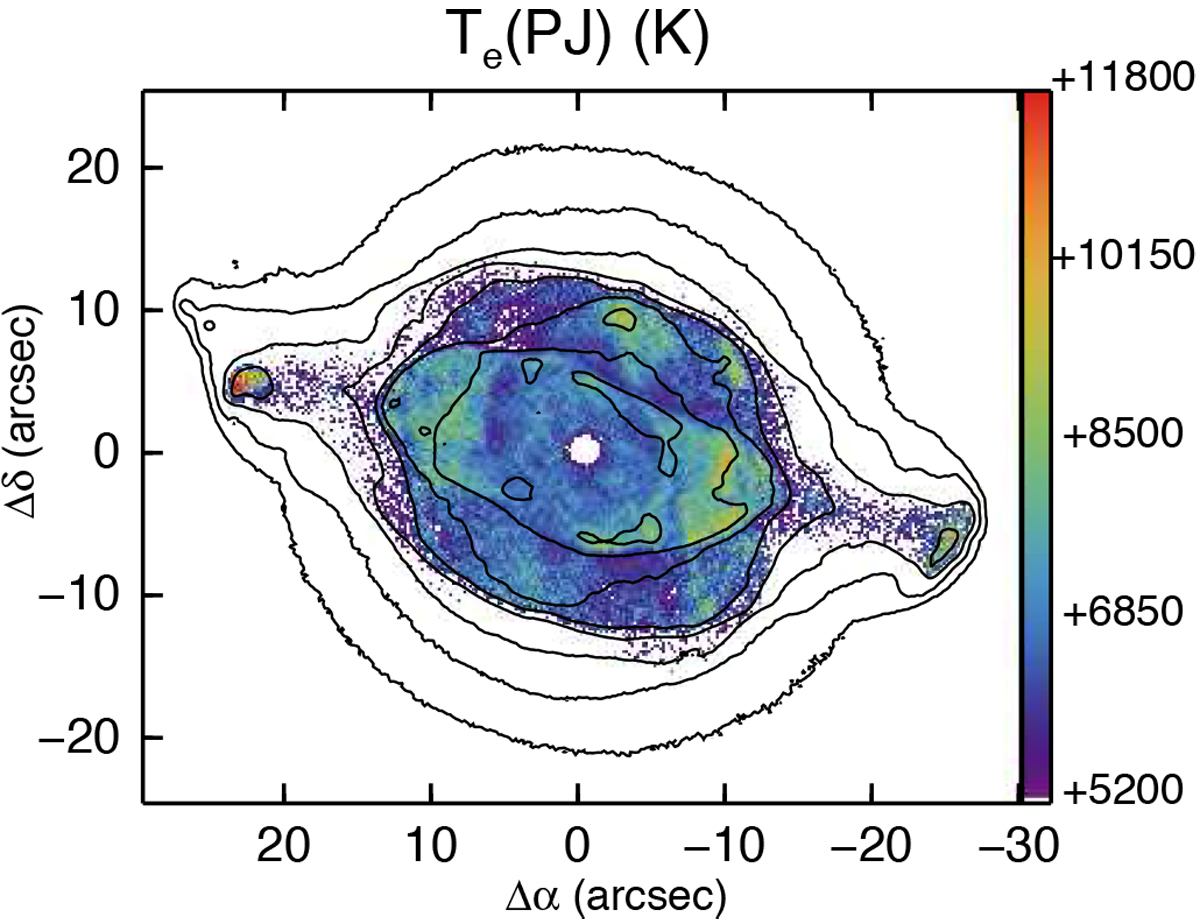
Map of Te derived from the magnitude of the Paschen continuum jump at 8250 Å ratioed by the dereddened H I Paschen 11 (8862.8 Å) emission line strength. Initial estimates of Te and Ne from the [S III] and [Cl III] ratio maps (Sect. 5.1) were applied, followed by two iterations with the derived Te map from the Paschen Jump. See text for details. The low Te values over the central star are not representative and arise from the strong stellar continuum. The log F(H β) surface brightness contours are as in Fig. 7. The mean signal-to-error is 13.
Current usage metrics show cumulative count of Article Views (full-text article views including HTML views, PDF and ePub downloads, according to the available data) and Abstracts Views on Vision4Press platform.
Data correspond to usage on the plateform after 2015. The current usage metrics is available 48-96 hours after online publication and is updated daily on week days.
Initial download of the metrics may take a while.