Fig. 7
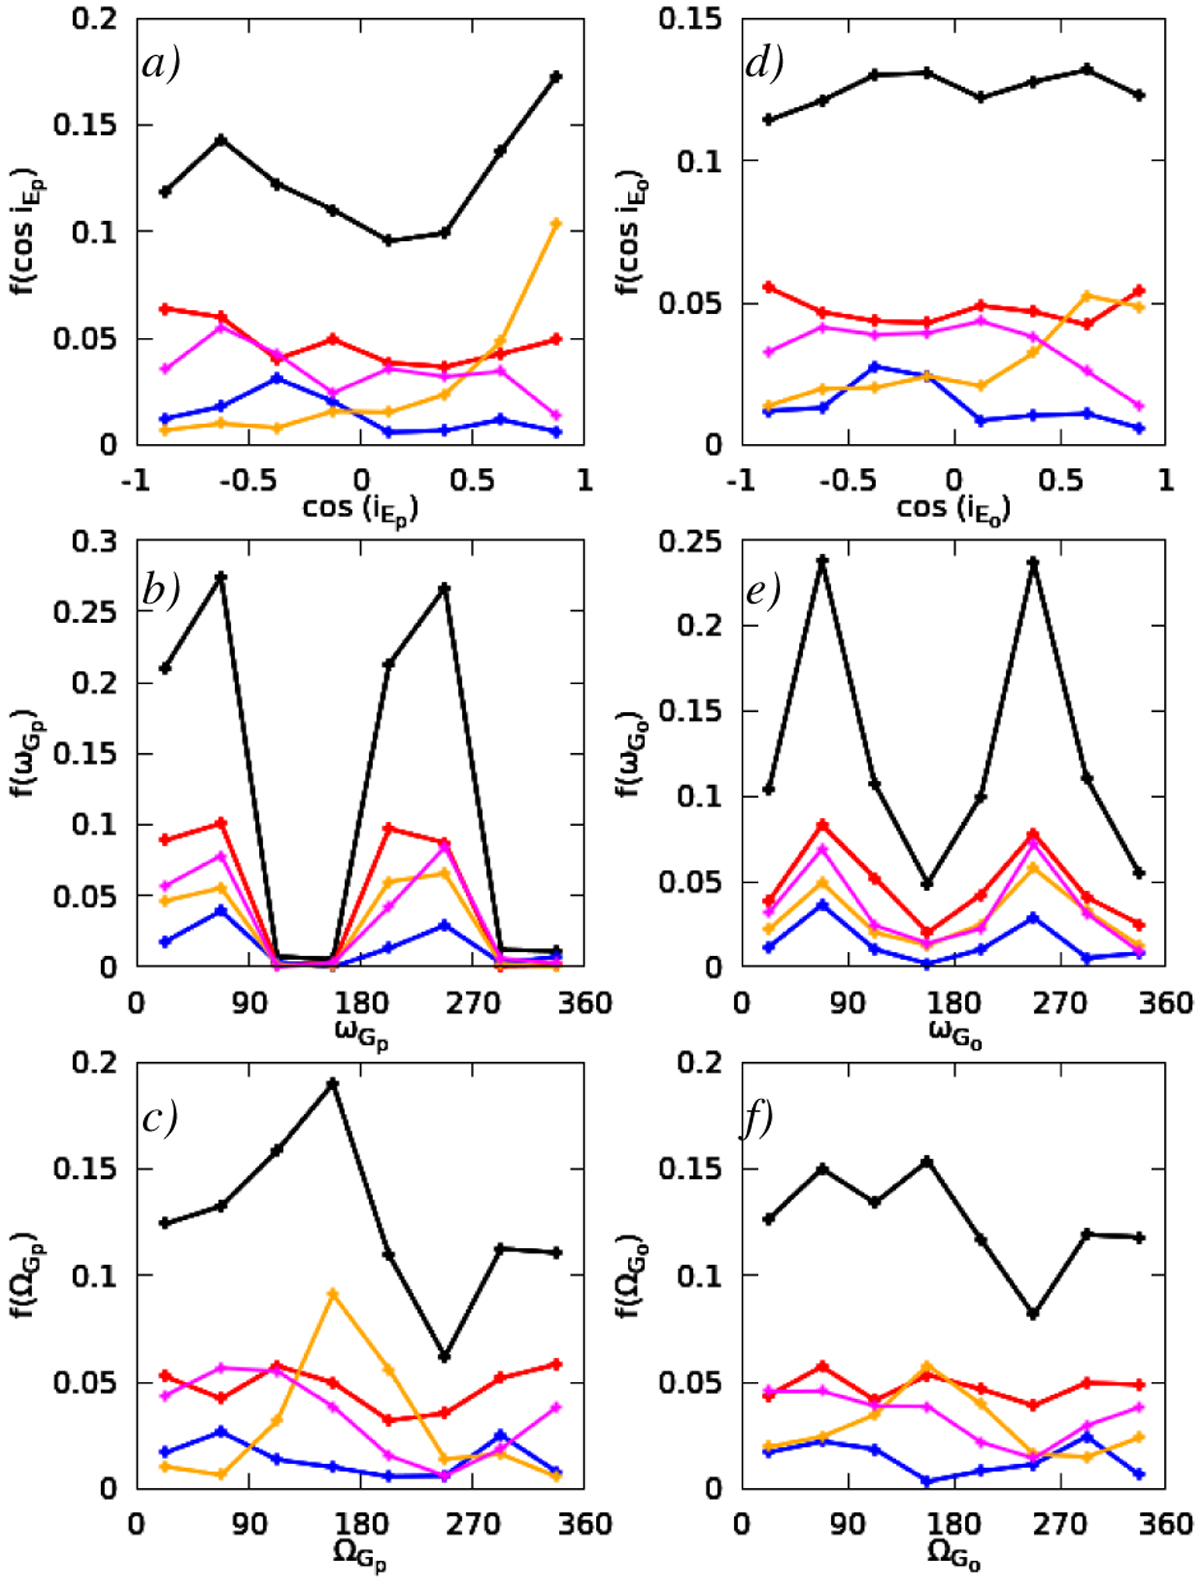
Panels a and d: distributions of cosiE where iE is the ecliptic inclination; panels b and e: distributions of the Galactic argument of perihelion ωG ; panels c and f: distributions of the Galactic longitude of the ascending node ΩG. Panels a–c:original orbit at the observable perihelion passage; panels e–g: orginal orbit at the previous perihelion passage. Foreach plot the black line is for all observable comets, the red line for jumpers, the blue line for creepers, the orange line for KQ-jumpers, and the magenta line for the KQ-creepers. The data are obtained from observable comets from the D0proto-Oort cloud.
Current usage metrics show cumulative count of Article Views (full-text article views including HTML views, PDF and ePub downloads, according to the available data) and Abstracts Views on Vision4Press platform.
Data correspond to usage on the plateform after 2015. The current usage metrics is available 48-96 hours after online publication and is updated daily on week days.
Initial download of the metrics may take a while.