Fig. 6
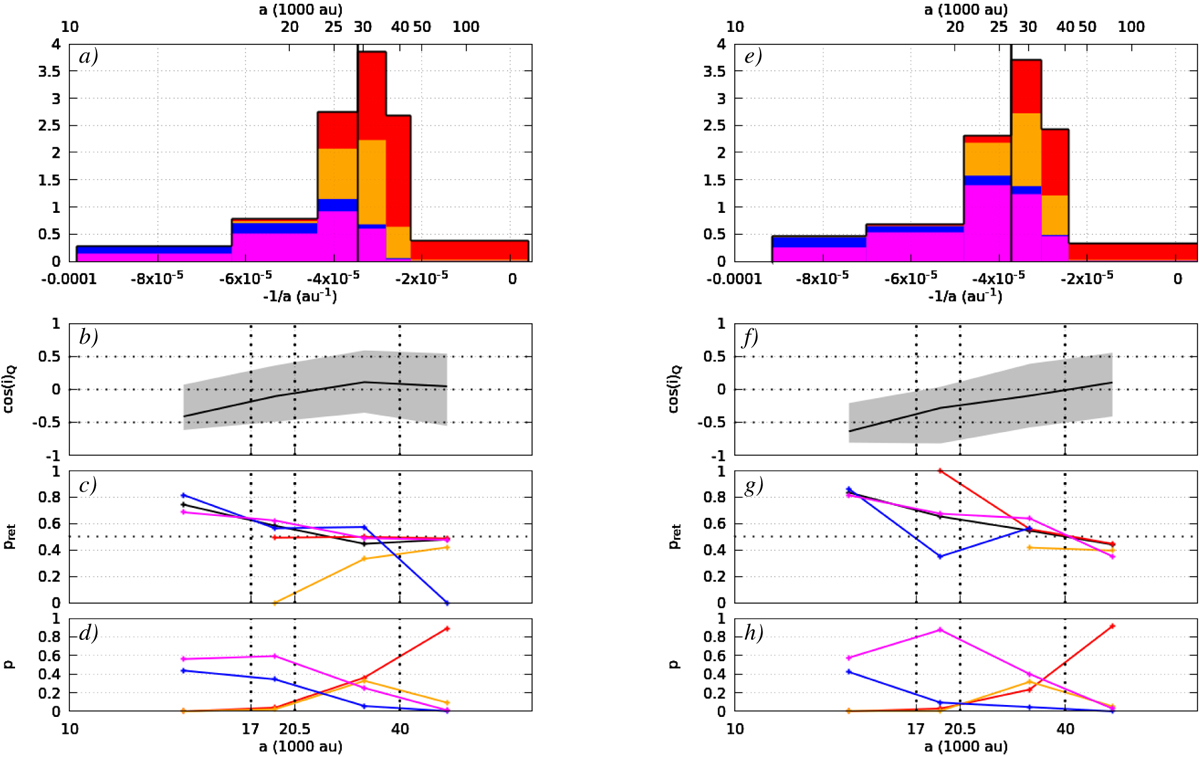
Panels a and e: distributions of the original orbital energy z = 1∕a (see text for details). The remaining panels give quantity for four different range of semi-major axes (see text for details). Panels b and f: median of cos iE (black line) and first and third quartiles (boundary of gray area). Panels c and g: proportion of retrograde orbits (black line: all comets, red line: jumpers, blue line: creepers, orange line: KQ-jumpers, magenta line: KQ-creepers). Panels d and h: proportions of comets in each observable class is given (same color code as for the third row). Panels a–d: D0 proto-Oort cloud. Panels e and f: I0 proto-Oort cloud.
Current usage metrics show cumulative count of Article Views (full-text article views including HTML views, PDF and ePub downloads, according to the available data) and Abstracts Views on Vision4Press platform.
Data correspond to usage on the plateform after 2015. The current usage metrics is available 48-96 hours after online publication and is updated daily on week days.
Initial download of the metrics may take a while.