Fig. 5
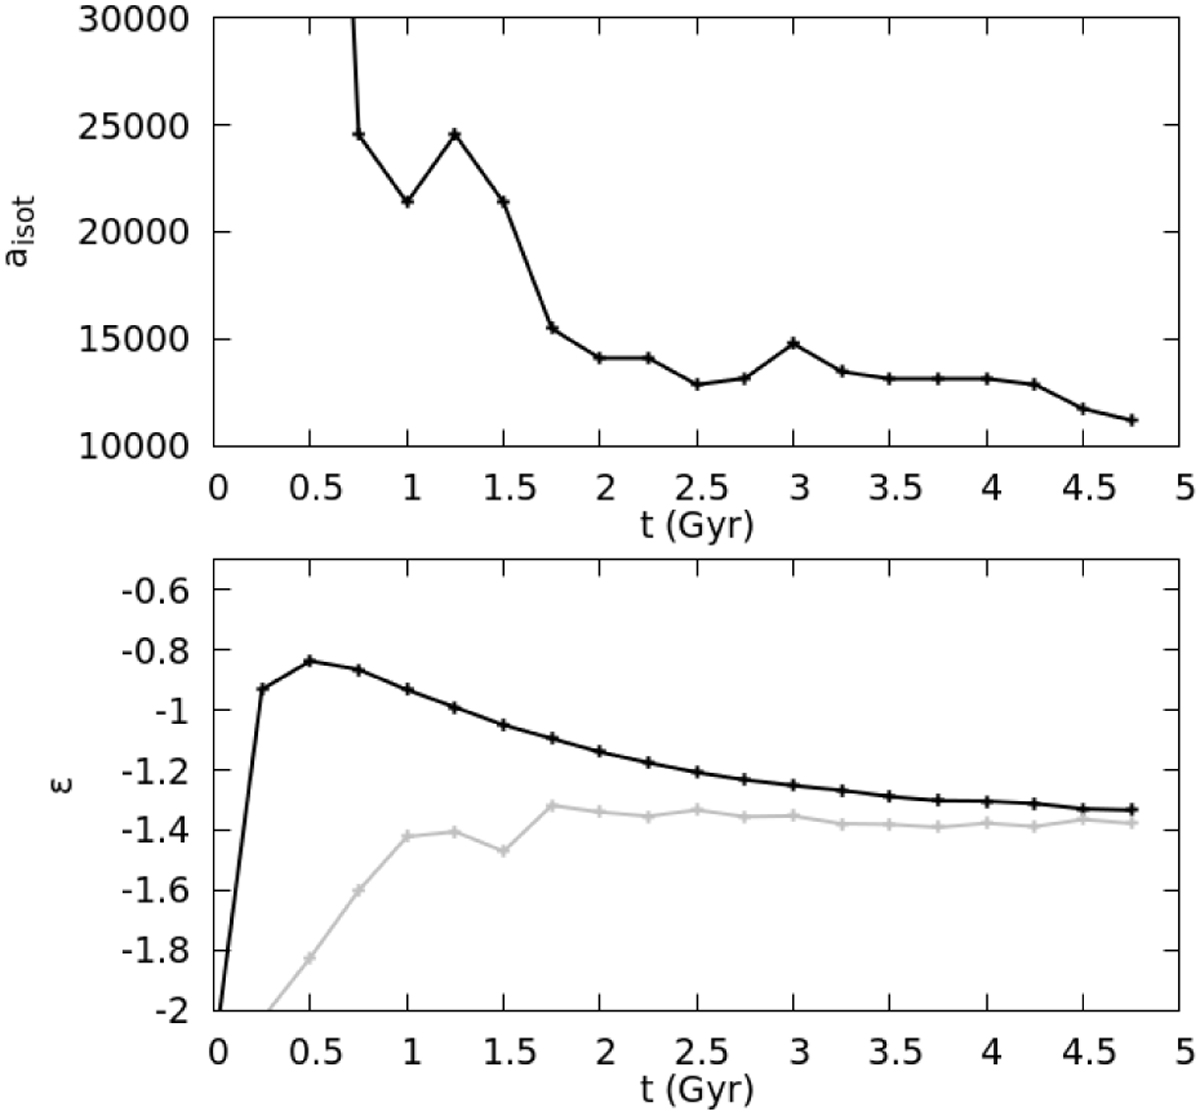
Upper panel: evolution of aisot with time for the D0 model. Lower panel: evolution versus time of the power law exponent for the best fit to the orbital energy distribution for 5000 < a < 30 000 au (black line) and for aisot < a < 30 000 au (gray line).
Current usage metrics show cumulative count of Article Views (full-text article views including HTML views, PDF and ePub downloads, according to the available data) and Abstracts Views on Vision4Press platform.
Data correspond to usage on the plateform after 2015. The current usage metrics is available 48-96 hours after online publication and is updated daily on week days.
Initial download of the metrics may take a while.