Fig. 2
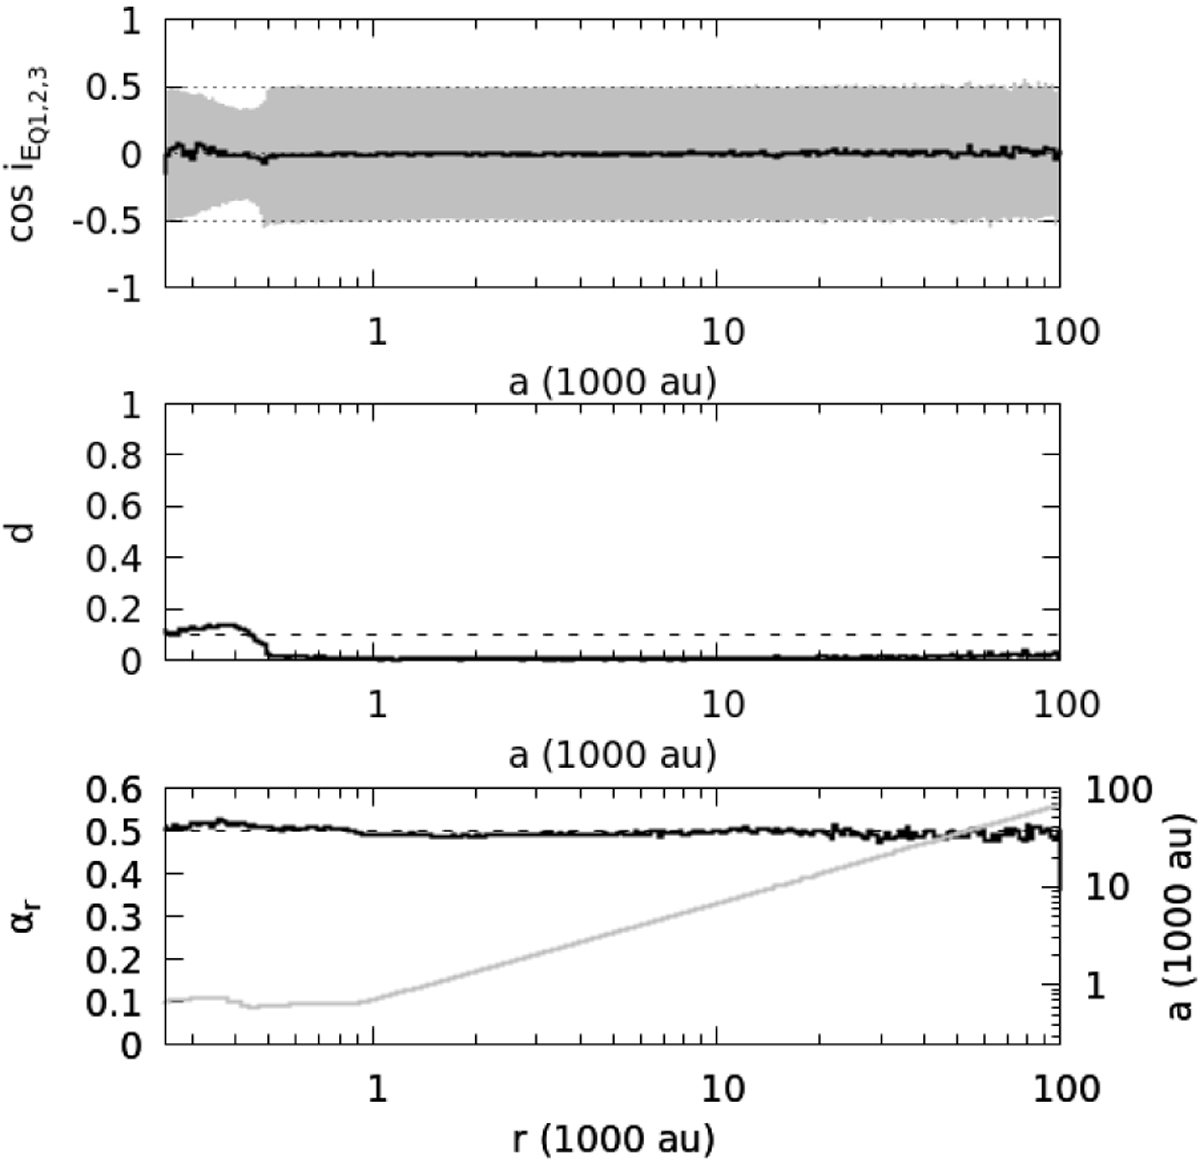
Top panel: evolution of the median ![]() (black) and the first and third quartiles
(black) and the first and third quartiles ![]() (lower and upper borders of the gray area) of cosiE versus the semi-major axis. Middle panel: evolution of the maximum distance d (see text for details) versus semi-major axis. Bottom panel: evolution of αr (see text for details) versus heliocentric distance. The averaged semi-major axis (on the right vertical axis) versus the heliocentric distance r is given by the gray line. The data are obtained from the evolution of the I0 proto-Oort cloud for 4 Gyr.
(lower and upper borders of the gray area) of cosiE versus the semi-major axis. Middle panel: evolution of the maximum distance d (see text for details) versus semi-major axis. Bottom panel: evolution of αr (see text for details) versus heliocentric distance. The averaged semi-major axis (on the right vertical axis) versus the heliocentric distance r is given by the gray line. The data are obtained from the evolution of the I0 proto-Oort cloud for 4 Gyr.
Current usage metrics show cumulative count of Article Views (full-text article views including HTML views, PDF and ePub downloads, according to the available data) and Abstracts Views on Vision4Press platform.
Data correspond to usage on the plateform after 2015. The current usage metrics is available 48-96 hours after online publication and is updated daily on week days.
Initial download of the metrics may take a while.