Fig. 12
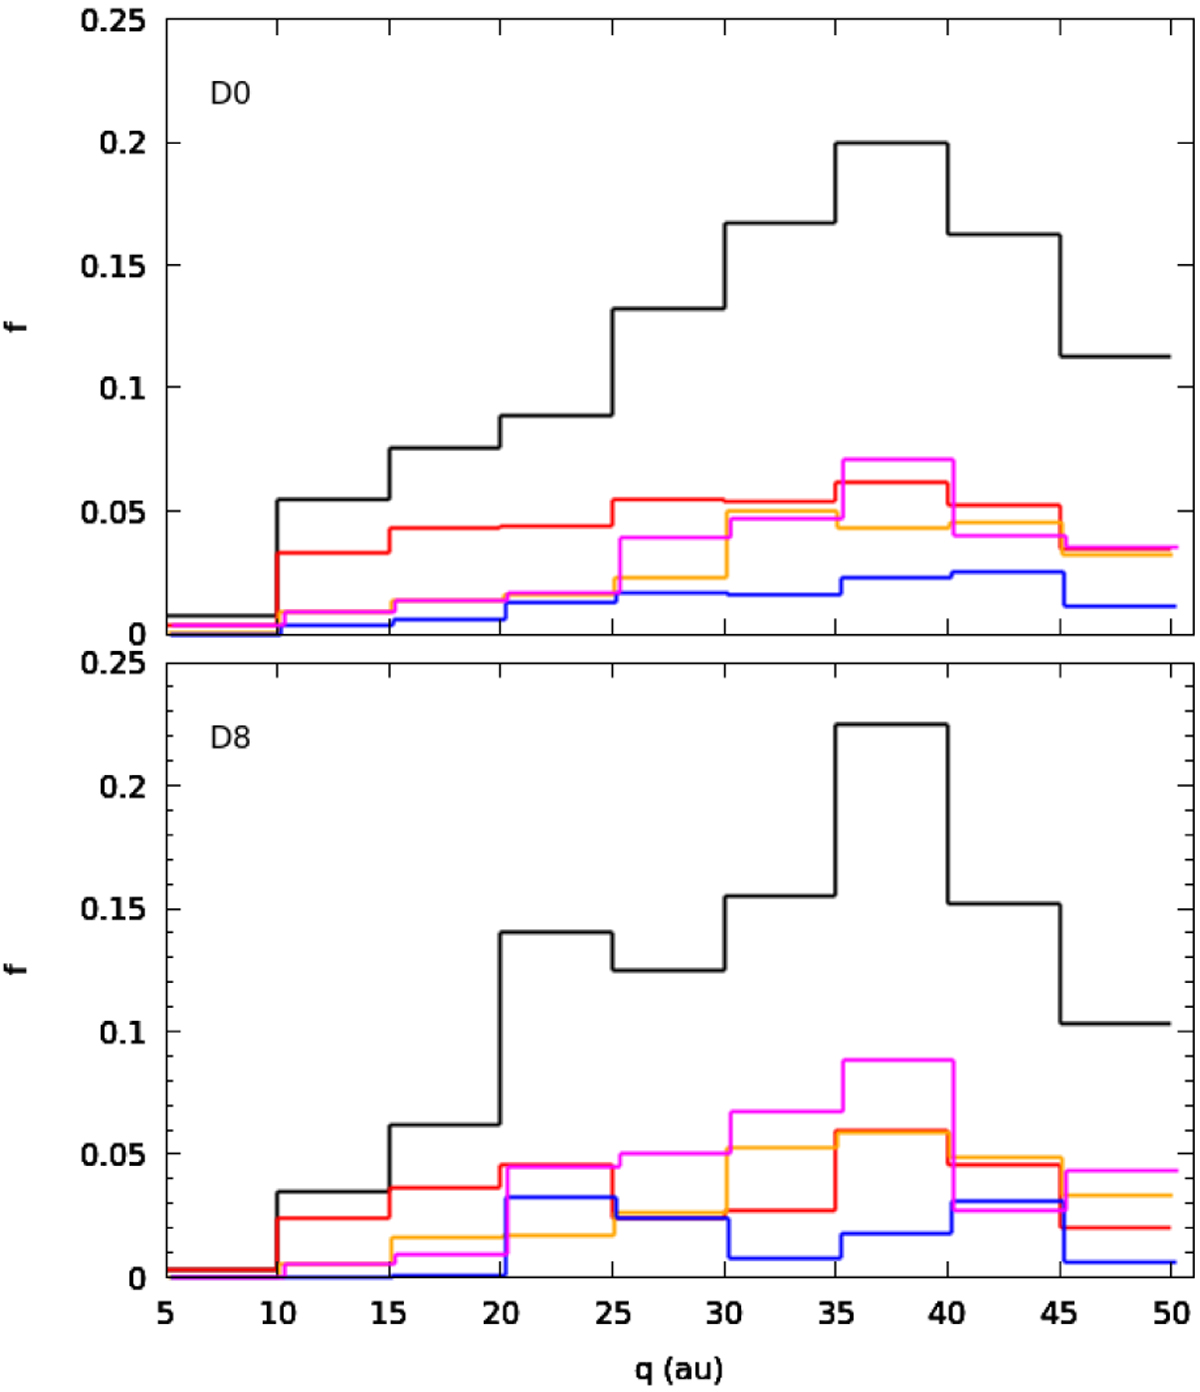
Initial perihelion distance distribution for all observable comets (black line) and for the four different observable classes: red for jumpers, blue for creepers, orange for KQ-jumpers and magenta for KQ-creepers. Top panel is for the D0 model and bottom panel is for the D8 model.
Current usage metrics show cumulative count of Article Views (full-text article views including HTML views, PDF and ePub downloads, according to the available data) and Abstracts Views on Vision4Press platform.
Data correspond to usage on the plateform after 2015. The current usage metrics is available 48-96 hours after online publication and is updated daily on week days.
Initial download of the metrics may take a while.