Fig. 11
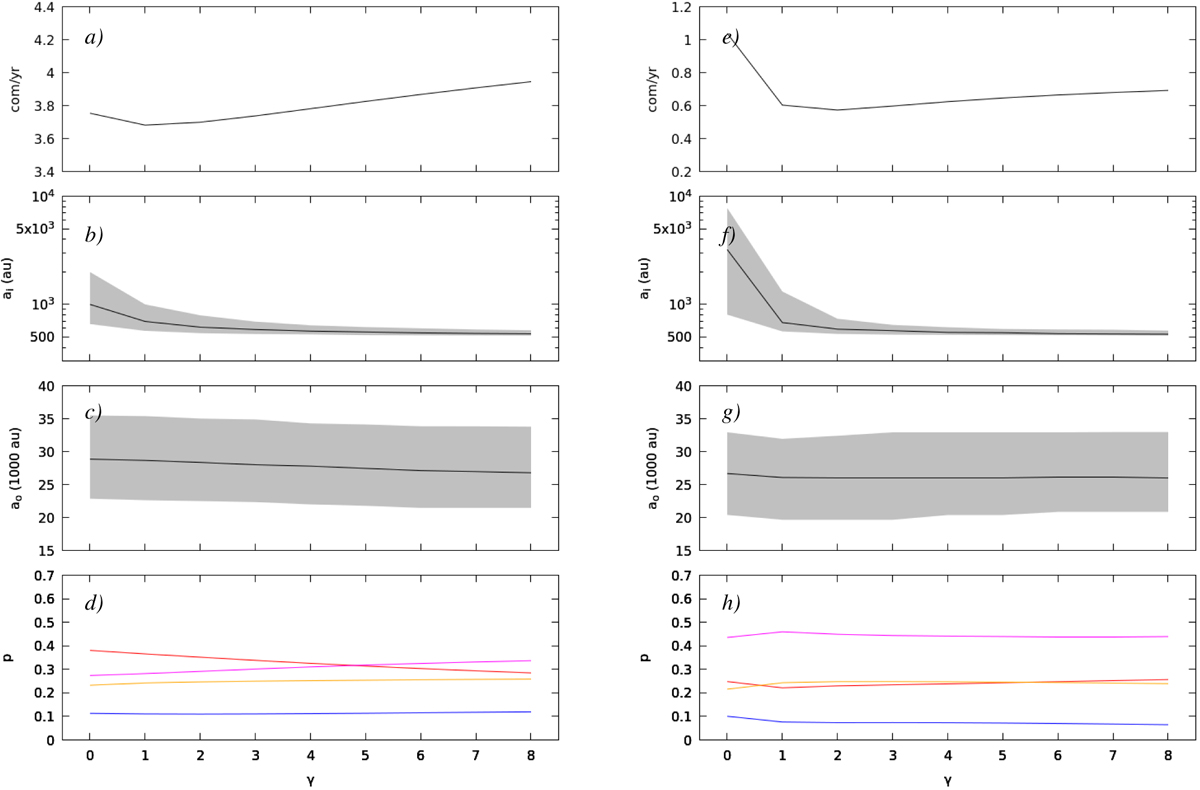
Behaviors with respect to γ (exponent of the power law for the initial orbital energy distribution). Panels a and e: flux of observable comets per year (normalized for an initial Oort cloud with 1012 comets. Panels b and f: first, second (black line) and third quartiles for the initial semi-major axis. Panels c and g: first, second (black line) and third quartiles for the original semi-major axis. Panels d and h: proportion of observable comets in each class (red for jumpers, blue for creepers, orange for KQ-jumpers and magenta for KQ-creepers). Panels a–d: disk-like proto-Oort cloud. Panels e–h: isotropic proto-Oort cloud.
Current usage metrics show cumulative count of Article Views (full-text article views including HTML views, PDF and ePub downloads, according to the available data) and Abstracts Views on Vision4Press platform.
Data correspond to usage on the plateform after 2015. The current usage metrics is available 48-96 hours after online publication and is updated daily on week days.
Initial download of the metrics may take a while.