Fig. 8.
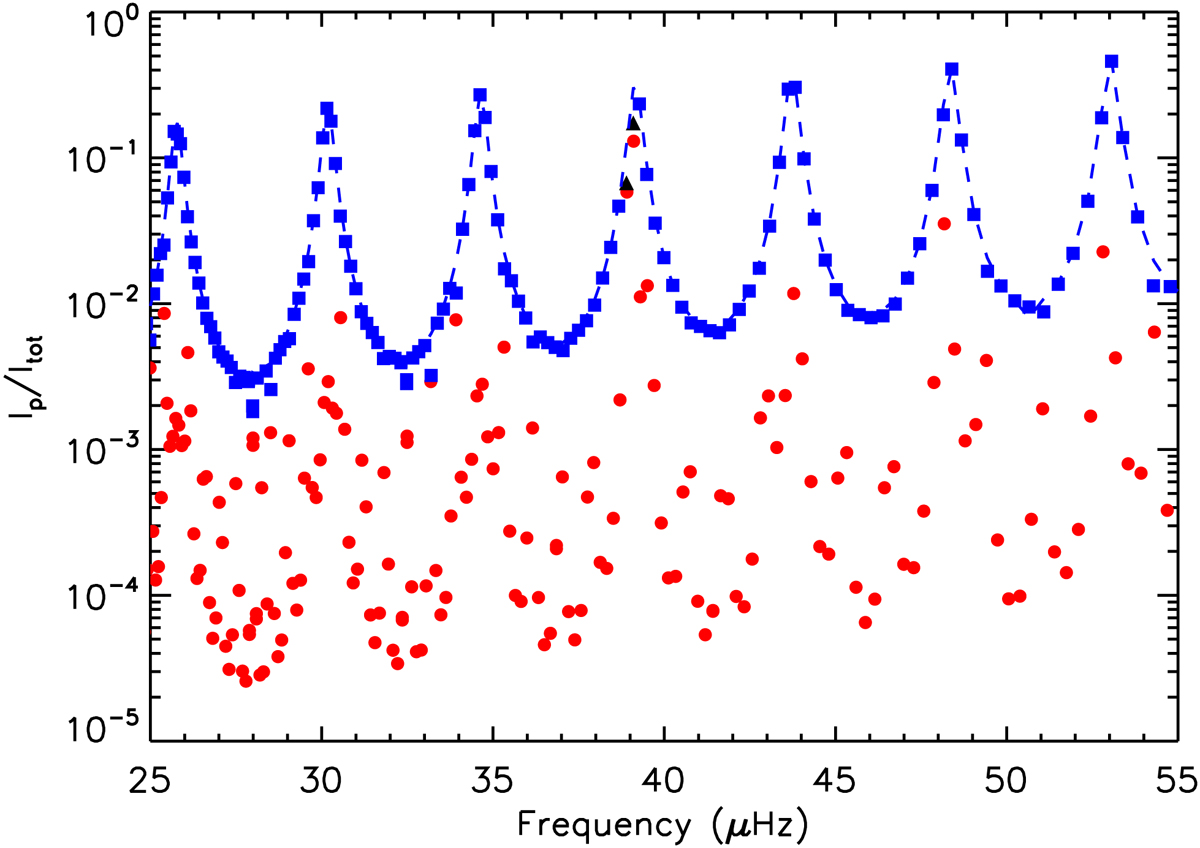
Fractional contribution of the acoustic cavity to the mode inertia (and thus to the mode kinetic energy) using the global seismic parameters of model 1 and assuming an intermediate coupling between the two g-mode cavities (q1 = 10−2). Modes that have more than 50% of the energy trapped in the g1 (resp. g2) cavity are shown as filled red circles (resp. blue squares). Other modes are shown as filled black triangles. The dashed blue curve indicates the ratios of inertia Ip/Itot that would be obtained for mixed modes trapped only in the g2 and p mode cavities.
Current usage metrics show cumulative count of Article Views (full-text article views including HTML views, PDF and ePub downloads, according to the available data) and Abstracts Views on Vision4Press platform.
Data correspond to usage on the plateform after 2015. The current usage metrics is available 48-96 hours after online publication and is updated daily on week days.
Initial download of the metrics may take a while.