Fig. 10.
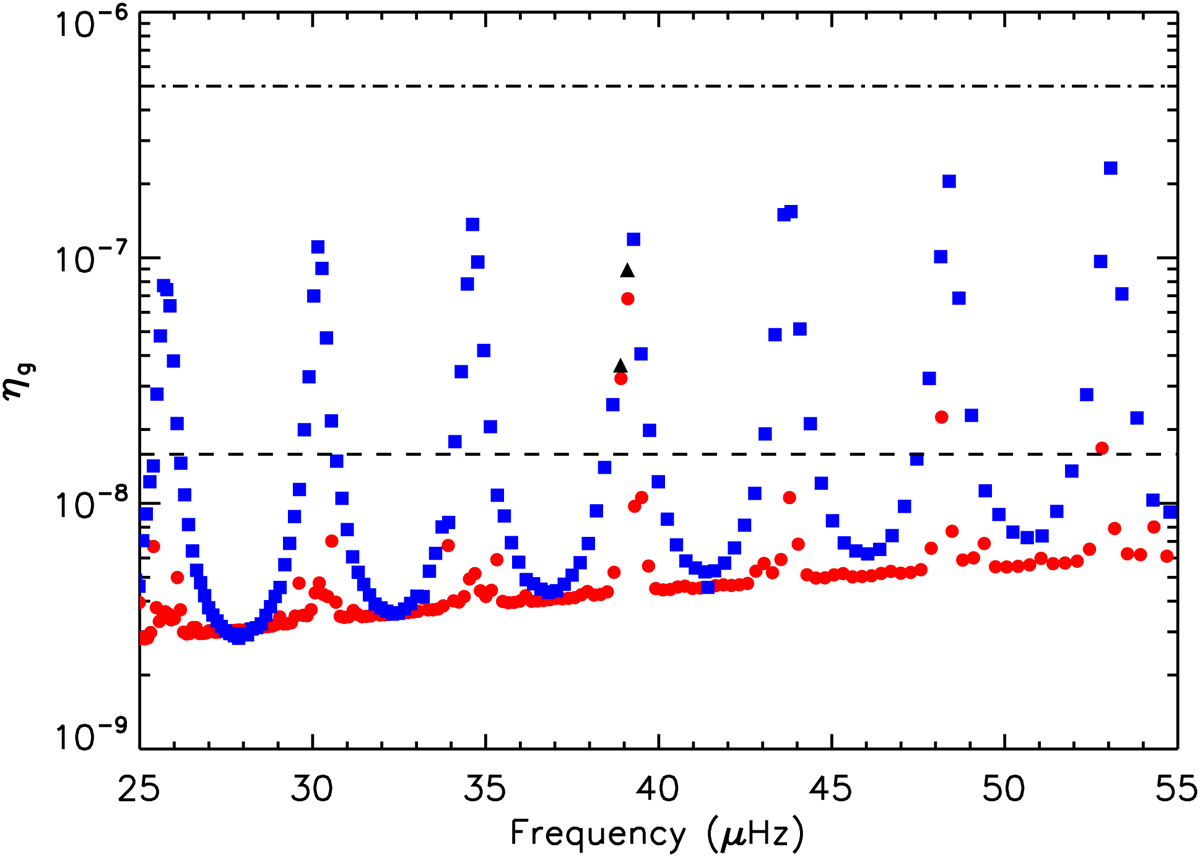
Damping rates ηmix of mixed modes obtained from a JWKB analysis using the global seismic parameters of model 1 and assuming an intermediate coupling between the two g-mode cavities (q1 = 10−2). The symbols are the same as in Fig. 8. The horizontal dash-dotted line indicates the damping rates of p modes inferred from seismic observations of typical clump stars (see text). The threshold ηlim = 2/Tobs below which modes are unresolved is represented by the horizontal dashed line (we assumed a duration of Tobs = 4 yr, corresponding to the longest datasets of Kepler).
Current usage metrics show cumulative count of Article Views (full-text article views including HTML views, PDF and ePub downloads, according to the available data) and Abstracts Views on Vision4Press platform.
Data correspond to usage on the plateform after 2015. The current usage metrics is available 48-96 hours after online publication and is updated daily on week days.
Initial download of the metrics may take a while.