Free Access
Fig. 1.
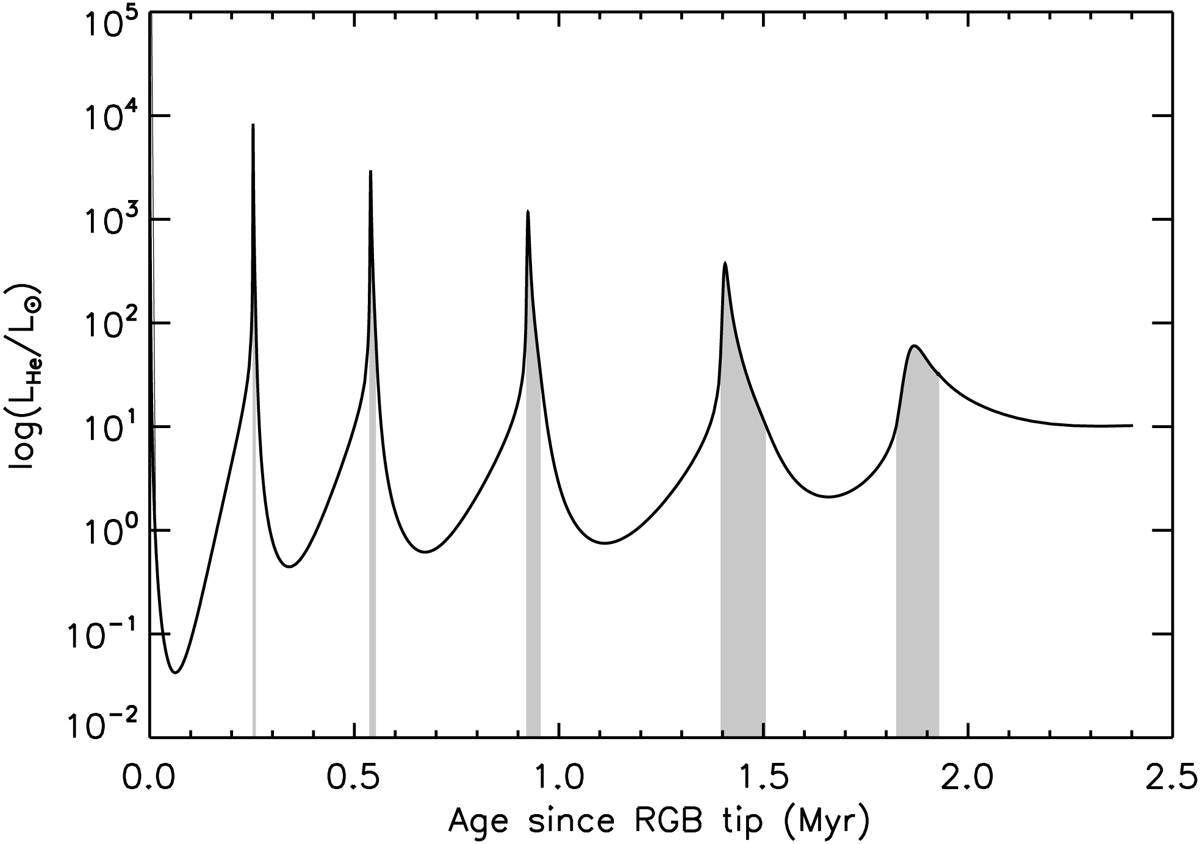
Variations in the luminosity produced by He-burning during the He-subflashes of a 1.7 M⊙ model computed with MESA. The shaded areas indicate periods during which the (convective) He-burning region splits the g-mode cavity in two.
Current usage metrics show cumulative count of Article Views (full-text article views including HTML views, PDF and ePub downloads, according to the available data) and Abstracts Views on Vision4Press platform.
Data correspond to usage on the plateform after 2015. The current usage metrics is available 48-96 hours after online publication and is updated daily on week days.
Initial download of the metrics may take a while.