| Issue |
A&A
Volume 620, December 2018
|
|
|---|---|---|
| Article Number | A179 | |
| Number of page(s) | 6 | |
| Section | Planets and planetary systems | |
| DOI | https://doi.org/10.1051/0004-6361/201833408 | |
| Published online | 14 December 2018 | |
Umov effect in asteroid (3200) Phaethon
1
Ussuriysk Astrophysical Observatory of FEB RAS,
Gornotaezhnoe 692533,
Russia
2
School of Natural Sciences, Far Eastern Federal University,
8 Sukhanova St.,
Vladivostok 690950,
Russia
3
Astronomical Institute of the Slovak Academy of Sciences,
05960 Tatranská Lomnica,
Slovak Republic
e-mail: This email address is being protected from spambots. You need JavaScript enabled to view it.
4
Main Astronomical Observatory of National Academy of Sciences,
27 Akademika Zabolotnoho St. 03143,
Kyiv, Ukraine
5
Astronomical Observatory, Taras Shevchenko National University of Kyiv,
3 Observatorna St.,
04053,
Kyiv, Ukraine
Received:
11
May
2018
Accepted:
22
October
2018
Abstract
Context. The near-Earth asteroid (3200) Phaethon occasionally reveals a comet-like activity. It is a parent body to the Geminid meteor shower and considered as a target for the space mission called Demonstration and Experiment of Space Technology for Interplanetary Voyage Phaethon Flyby Dust Science, DESTINY+.
Aims. We aim to characterize Phaethon through measurements of the degree of linear polarization P measured on Phaethon at large phase angles on its closest approach to Earth on December 17, 2017. These observations allow a more accurate estimation of the maximum value of the degree of linear polarization Pmax of Phaethon, and therefore, of studying the Umov effect.
Methods. We performed polarimetric measurements of Phaethon at large phase angles α and thus constrained its Pmax. We also estimated the geometric albedo a based on the data available in the literature. The obtained Pmax and A were analysed with the Umov effect previously derived for the Moon that establishes an inverse linear correlation between log(Pmax) and log(A) in the lunar regolith.
Results. Our polarimetric observations of Phaethon in the visible reveal the degree of linear polarization P ≈ (17.23 ± 2.00)% at α ≈ 57.9° and P ≈ (31.86 ± 2.00)% at α ≈ 73.2°, which demonstrates no significant wavelength dependence within the error bars of our measurements (± 2%). These data, when combined with what has previously been reported in the literature, suggests at least three types of polarimetric response on Phaethon. For two of them, we infer the maximum linear polarization to be Pmax ≈ 57.9%, occurring at αmax = 131° and Pmax ≈ 44.5% occurring at αmax = 127°. We estimate the geometric albedo (adjusted to α = 3°) to be AR = 0.075 ± 0.007 in the R filter, which appears to be consistent with dark F-type asteroids, as which Phaethon was first classified. We examine the Umov diagrams previously inferred for lunar regolith and find that they are hardly applicable to Phaethon and therefore not to other asteroids either.
Key words: minor planets, asteroids: general / minor planets, asteroids: individual: (3200) Phaeton / polarization / scattering / methods: miscellaneous
© ESO 2018
1 Introduction
Asteroid (3200) Phaethon is an outstanding small body in the solar system. This asteroid experiences close encounters with Earth, making it possible to perform radar investigations (Taylor et al. 2018). Its perihelion is quite close to the Sun, only ~0.14 AU, which suggests a systematic strong heating of the surface. Phaethon reveals comet-like activity (Jewitt 2012), and it is believed to be a parent body to the Geminid meteor shower (Williams & Wu 1993). These three features make Phaethon a legitimate target for space-probe exploration (e.g., Arai et al. 2018). There is also significant scientific interest in ground-based astronomical observationsaimed at retrieving physical and chemical properties of Phaethon (e.g., Fornasier et al. 2006; Ansdell et al. 2014; Hanuš et al. 2016; Ito et al. 2018).
The basic characteristics of an asteroid are its size, the geometric albedo in the visible pV, and the phase function. Photometric observations provide direct access to its phase function, whereas its projected area and geometric albedo appear as a product whose factorization cannot be accomplished solely within the framework of photometry. This requires incorporation of other techniques. The most accurate approach here is a radar study that can visualize the shape of a near-Earth target. Phaethon was investigated using radar on its closest approach to Earth in December 2017. It was found to have a shape somewhat similar to what was recently seen by Hayabusa 2 in asteroid (162173) Ryugu, with an equivalent diameter of ~5.7 km (Taylor et al. 2018; Taylor, priv. comm.).
The geometric albedo in the visible pV and the size of an asteroid can also be constrained from its mid-IR response. Using the Infrared Astronomical Satellite (IRAS) data, Tedesco et al. (2002) found pV = 0.1066 ± 0.001 and a diameter D = (5.1 ± 0.2) km. We also mention the work by Hanuš et al. (2016), who estimated the geometric albedo using IRAS data in the range from 0.09 to 0.15. Obviously, the IRAS diameter appears noticeably smaller than what emerges from the radar study of Phaethon; the projected area is ~20% smaller. The reason for this discrepancy is that the analysis of the IRAS data is based on rough approximations of absorptivityin the visible and emissivity in the mid-IR of asteroidal regolith. It is worth noting that the systematic underestimation of the diameter inferred from the IRAS data was also emphasized in Tedesco et al. (2002). That such a discrepancy exists suggests that the geometric albedo retrieved from the IRAS data may be inaccurate as well.
We here present polarimetric observations of asteroid (3200) Phaethon measured in the visible at large phase angles. We conduct a comparative analysis of our observations versus the results of other polarimetric studies of Phaethon, and in particular, improve the estimates of its maximum linear polarization. Furthermore, using the most recent finding on the shape of Phaethon (Taylor et al. 2018), we also constrain its geometric albedo. This makes it possible to investigate the Umov effect on Phaethon. The Umov effect provides a means of constraining the geometric albedo of asteroids from their polarimetric response.
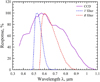 |
Fig. 1 Response of the CCD detector used in our observations vs. transmittance of the V and R filters in theJohnson-Cousins photometric system. |
2 Observations
We observed asteroid (3200) Phaeton at the prime focus of the 22 cm telescope that is located at the Ussuriysk Astrophysical Observatory (code C15), which operates within the International Scientific Optical Network (ISON). Weather conditions were favorable for observations on three closest-approach dates, December 14, 16, and 17 in 2017. In the first epoch, we conducted a 2.5-h series of photometric observations aimed to infer the light curve of Phaethon; in the two other epochs, we measured the degree of linear polarization P. The telescope was equipped with a commercially available CCD detector, FLI PL09000, which has a resolution of 3056 × 3056 pixels and pixel size of 12 μm. The full field of view of the CCD detector is 243 × 243 arcmin with an angular resolution of 4.73 × 4.73 arcsec per pixel. The response of the CCD detector as a function of the wavelength λ is shown in Fig. 1. We also show here the transmittance of the V and R filters in the Johnson-Cousins photometric system. The CCD detector has a wide range of sensitivity with a maximum at λ ~ 0.57 μm and an FWHM ≈ 0.46 μm. The latter suggests that our polarimetric measurements should be compared with other polarimetric observations of Phaethon with caution because they are typically conducted with much narrower photometric filters. We exploit a relatively small telescope, which places certain limitations on the use of photometric filters as they significantly reduce the apparent magnitude of the target.
Observations of the twilight sky were made to provide flat-field corrections. The raw images were processed using the IRAF software1, which includes a basic bias subtraction, flat-field correction, and removal of cosmic ray events. In the polarimetric measurements, a dichroic polarization filter (analyzer) is additionally used. The analyzer was consequently rotated over three fixed position angles 0°, + 60°, and + 120°. Using these measurements, the degree of linear polarization P of Phaethon(Eq. (1)) can be obtained through the Fesenkov formulae (Fesenkov 1935). The Fesenkov formulae sometimes are used without a reference to the original work by Fesenkov. For instance, they are exploited in Hines et al. (2014) and Ivanova et al. (2015), which also provide more details on these equations. For calibration purposes, including determination of instrumental polarization, the polarized and non-polarized standard stars from the lists of Hsu & Breger (1982), Schmidt et al. (1992) and Heiles (2000) were observed. We found the instrumental polarization to be lower than 0.7%.
Table 1 gives a summary of our observations, showing the epoch of observation (the begin-cycle time, UT), the heliocentric r and geocentric Δ distances, the phase angle α of Phaethon, the exposure time Texp, the number of observations obtained in one night N, and the obtained degree of linear polarization P with the corresponding error bars.
Observation logs of asteroid (3200) Phaeton in December 2017.
3 Comparative analysis of the polarization of Phaethon
When initially unpolarized solar radiation is scattered by asteroidal or planetary regolith, it acquires a partial linear polarization that is quantified with the degree of linear polarization,
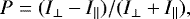 (1)
(1)
where I⊥ and I∥ denote the intensity of the scattered light that is polarized perpendicular to the scattering plane and within the scattering plane, respectively. Polarization P is a function of the phase angle α. Asteroidal and planetary regolith, as well as their terrestrial analogs, reveal somewhat similar angular profiles of the degree of linear polarization (e.g., Dollfus et al. 1971; Shkuratov et al. 2004; Fornasier et al. 2006). At small phase angles α < 15°, P takes on predominantly negative values, implying I∥ > I⊥. Over the range α < 15°–30°, the degree of linear polarization changes its sign; the phase angle where this inversion occurs is denoted as the inversion angle αinv. At greater phase angles, P takes on positive values (i.e., I∥ < I⊥). Moreover, it reveals a non-monotonic behavior with a maximum value Pmax typically attained at αmax ≈ 70°–110°.
In Fig. 2 we plot the degree of linear polarization P of Phaethon as a function of phase angle α that was measured by four different groups. These four sets of data were obtained in different epochs and at different wavelengths λ. Fornasier et al. (2006) measured polarization in 2004 through the Johnson-Cousins V filter, Ito et al. (2018) in 2016 with the Johnson-Cousins R filter, and Devogèle et al. (2018) in 2017 with the Johnson-Cousins BV RI filters. We reproduce in Fig. 2 only the data obtained with the R filter, however, while in thiswork, we report measurements made in 2017 with the polarimetric response being integrated over a wide range of wavelengths (see Fig. 1). Figure 2 shows that all four data sets tend to be grouped along a single curve at phase angle α < 60°. Interestingly, our measurement at α = 57.9° within the error bars (± 2%) matches the measurement at α = 57.7° reported by Ito et al. (2018). This resemblance suggests a weak wavelength dependence of the degree of linear polarization of Phaethon, at least at this particular α. This behavior is similar to what was previously found at large phase angles in asteroids (1685) Toro (Kiselev et al. 1990) and (4179) Toutatis (Ishiguro et al. 1997). Devogèle et al. (2018) reported the wavelength dependence of the polarization of Phaethon to be ~1–2% in the V and R filters at phase-angle range α ~ 60–70°, which is consistent with our finding. We also note that Phaethon reveals no noticeable wavelength dependence in its photometric response (Ansdell et al. 2014).
At larger phase angles, the degree of linear polarization measured by Ito et al. (2018) appears to be systematically higher than what was detected by Devogèle et al. (2018), up to ~10% at α ~ 110°. This discrepancy could be explained with a significant heterogeneity in the surface of Phaethon and with the different observation conditions in 2016 and 2017. However, our observation at α = 73.2° reveals polarization that is ~8% higher than what can be inferred from observations by Devogèle et al. (2018) for the same 2017 apparition of Phaethon. Our measurement considerably exceeds (~5%) even that was reported in Ito et al. (2018). For observations with the 1.6 m Pirka telescope at the Nayoro Observatory in Hokkaido, Japan (Ito et al. 2018), the ecliptic latitude of Phaeton varied in the range from 39° to 71°, while for our observations, this variation was from 25° to 18°. One possible explanation of this difference is a very strong wavelength dependence of the polarization in Phaethon in the epoch of our observation that substantially exceeds what was reported in Devogèle et al. (2018). This wavelength dependence should affect our results as we measured the polarization of Phaethon without filters. Thus, Devogèle et al. (2018), Ito et al. (2018), and our own study suggest at least three different types of polarimetric response in the surface of Phaethon.
We note that on December 14, 2017, we measured the light curve of Phaethon. It revealed some oscillations in its apparent magnitude of up to Δm ≈ 0.2. This appears in good quantitative agreement with findings of Hanuš et al. (2016). When extrapolating the light curve obtained on December 14 toward December 17 with the rotational period of Phaethon being ~ 3.6 h (Krugly et al. 2002), it appears that the polarimetric observations at α = 73.2° were conducted at a global minimum of the asteroid brightness. There is a great deal of uncertainty about the mechanisms governing variations of brightness of Phaethon, but it could partly result from heterogeneity of its surface. The degree of linear polarization has long been known to be extremely sensitive to the microphysical properties of regolith (e.g., Shkuratov et al. 2004). Therefore, the three different types of polarimetric response found in Phaethon (see Fig. 2) suggest a large-scale heterogeneity of its surface.
For two of the three types of polarimetric response, those reported in Ito et al. (2018) and Devogèle et al. (2018), there are enough observational data for search functional expressions of their phase dependences of the degree of linear polarization P. We first examined the empirical function suggested by Lumme & Muinonen (1993) in application to data of Ito et al. (2018):
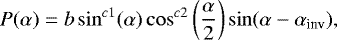 (2)
(2)
where b, c1, and c2 are free parameters, and αinv is the phaseangle of the inversion of the polarization sign that could be constrained, for instance, to α0 inv = 22° based on observations by Fornasier et al. (2006). According to Penttilä et al. (2005), Eq. (2) is capable of fitting the polarimetricresponse in numerous asteroids and comets. Unfortunately, we were unable to find a reasonable fit to the observations of Ito et al. (2018). Nevertheless, we inferred their polynomial fit. In the latter case, however, we added to the available data set an extra point, P = 0% at α = 180° that is incorporated by default into Eq. (2) along with P = 0% at α = 0°. These constraints on the polarization curve are well known from astronomical observations of asteroids and other atmosphereless solar systembodies as well as from laboratory measurements of structural analogs of planetary regolith (e.g., Shkuratov et al. 2004), and they can also be inferred from symmetry arguments.
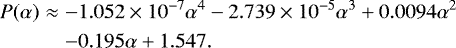
We find that a fourth-degree polynomial can closely reproduce the observations of Ito et al. (2018):
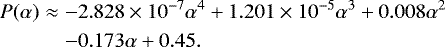 (3)
(3)
The results of the computations with Eq. (3) are shown in Fig. 2 with the brown dashed line. For the polarimetric response in the R filter reported by Devogèle et al. (2018), the fourth-degree polynomial fit is expressed as follows:
 (4)
(4)
The fit obtained with Eq. (4) is shown with the blue solid line in Fig. 2. Both fits describe their corresponding subsets of observations reasonably well.
The polynomial fits make it possible to estimate the maximum of the degree of linear polarization of Phaethon. Such an estimation is evidently based on assumption of a simple, bell-like shape of the angular profile of polarization, which was indeed found in atmosphereless solar system bodies and analogs of their regolith (e.g., Shkuratov et al. 2004). Nevertheless, our estimations of the polarization maximum require further validation in future observations of Phaethon. For instance, Eq. (3) yields Pmax ≈ 57.9% occurring at αmax = 131° and Eq. (4) yields Pmax ≈ 44.5% occurring at αmax = 127°. Both fits suggest a very high maximum of positive polarization in asteroid Phaethon compared to other atmosphereless bodies in the solar system, which was also noted in Ito et al. (2018) and Devogèle et al. (2018). For example, in asteroids (1685) Toro and (4179) Toutatis, the maximum polarization was found to be only Pmax ≈ (8.5 ± 0.7)% and (7.0 ± 0.2)%, respectively (Kiselev et al. 1990; Ishiguro et al. 1997). The aperture-averaged polarimetry of the nearside of the Moon reveals only Pmax ≈ 6.5%–9% (e.g., Shkuratov et al. 2004). It is worth noting, however, that imaging polarimetry reveals a much stronger response in some sites on the Moon, up to 24% (Shkuratov & Opanasenko 1992). Furthermore, laboratory measurements of the lunar samples may reveal even stronger polarization, such as Pmax ≈ 45% in the soils delivered by Luna 24 (Shkuratov & Opanasenko 1992, and therein), which appears to be more consistent with the extreme polarimetric response on Phaethon.
As we described above, our observation at α = 73.2° yields a degree of linear polarization of Phaethon that considerably exceeds those reported in Ito et al. (2018) and Devogèle et al. (2018). This does not immediately imply a higher Pmax, however, because our observation could correspond to a regolith whose maximum linear polarization appears at lower phase angle αmax. For example, when we assume αmax ≈ 100°, the amplitude of the positive polarization branch should be definitely lower than what emerges from Eqs. (3) and (4). This matter requires further polarimetric observations of Phaethon.
We emphasize that the polarization maximum plays an important role in planetary physics as it inversely correlates with the reflectance of regolith (e.g., Shkuratov & Opanasenko 1992). This correlation holds even in the case of single-scattering micron-size cosmic dust particles (Zubko et al. 2018). In the literature, this is referred to as the Umov effect or Umov law. In the next section we apply this phenomenon to asteroid (3200) Phaethon.
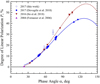 |
Fig. 2 Degree of linear polarization P as a functionof phase angle α in asteroid (3200) Phaethon obtained in three different epochs by four different groups (symbols) and polynomial fits (lines) to the observational data obtained in Ito et al. (2018) and Devogèle et al. (2018). |
4 Umov effect applied to Phaethon
Umov (1905) pointed out that the linear polarization of scattered light by a particulate medium inversely correlates with its reflectivity. In other words, the brighter is the target, the lower the linear polarization of the scattered light. This phenomenon later underwent a thorough investigation in application to lunar regolith (e.g., Dollfus et al. 1971; Shkuratov & Opanasenko 1992). A brief review of the Umov effect in astronomical applications is given by Zubko et al. (2011). What emerged from these efforts was a quantification of the Umov effect, that is, a linear inverse correlation between log (Pmax) and log (A), where A is the geometric albedo. We introduce an alternative symbol to designate the geometric albedo A in order to emphasize its difference with the previously discussed pV. While the latter designation corresponds to the geometric albedo measured in the V filter from the Johnson-Cousins photometric system, the geometric albedo A can be attributed to an arbitrary wavelength. It only is required that A and Pmax correspond to exactly the same waveband.
Figure 3 demonstrates the Umov effect as measured in 21 different sites on the Moon in blue and red filters, at λ = 0.42 and 0.65 μm, respectively. Data are adapted from Shkuratov & Opanasenko (1992). The measurements presented in Fig. 3 do not exactly correspond to the geometric albedo A and the polarization maximum Pmax. First of all, in ground-based observations, the Moon cannot be observed at exact opposition because of the lunar-eclipse phenomenon. Therefore, Shkuratov & Opanasenko (1992) attributed A to the phase angle α =3°, which is a somewhat better approximation than α = 5° used in Dollfus et al. (1971). Second, Shkuratov & Opanasenko (1992) measured positive polarization at α =113°, which is approximately interpreted as Pmax. Figure 3 shows that there is a great deal of overlap between the data points obtained with different filters, revealing little effect of the wavelength on the Umov effect in lunar regolith. The solid line shows a linear regression derived from all 42 data points, which takes the following form:
 (5)
(5)
Some data points in Fig. 3 may deviate from the regression line given by Eq. (5); this phenomenon is referred to as polarimetric anomalies (e.g., Shkuratov et al. 2018). The anomalies apparently imply a slight uncertainty in the interrelation between log(Pmax) and log(A).
The Umov diagram shown in Fig. 3 is very simple to use in practice as it allows for the immediate retrieval of the geometric albedo from the measured maximum of linear polarization. However, estimating the geometric albedo A enables interpreting the apparent magnitude of a target in terms of its visible projected area, which is illuminated by solar radiation. This area directly corresponds to the size of the target.
Unfortunately, the Umov effect in its classic form is hardly applicable to the vast majority of asteroids because they mainly belong to the main belt, located at a heliocentric distance larger than ~2.2 AU. This means that their phase angle in ground-based observations does not exceed ~ 27°. Therefore, the maximum linear polarization cannot be observed directly in such asteroids. This restriction stimulated the search for an Umov-effect analog that would refer the geometric albedo A to a light-scattering characteristic that is accessible in ground-based observations of the main-belt asteroids. This problem was resolved for asteroids by Zellner et al. (1974), who first applied the inverse correlation between log (h) and log (A), where h stands for the slope of the polarization curve at the inversion angle (see top panel in Fig. 1), which is measured in percent per degree. It is important to emphasize that this approach is actively exploited today in constraining the size of asteroids (e.g., Cellino et al. 2015).
Although the inverse correlation of log(h) and log(A) is physically related to the Umov effect, it is not as reliable as the correlation between log (Pmax) and log (A) in the case of dark regolith. As shown by Hapke (1993) and discussed by Zubko et al. 2011, the log (h)– log(A) diagram retains a straight linear form only at A > 0.05, while the log(Pmax)– log(A) diagram remains linear throughout the entire range of A. This can be explained by the significant role that single dust particles play in light scattering from extremely dark regolith (A < 0.05), where multiple scattering among constituent particles is weak. While the linear interrelation log (Pmax) vs. log (A) holds in single-scattering dust particles (Zubko et al. 2018), it is broken in log (h) vs. log (A) (Zubko et al. 2011). Therefore, an application of the log(h)– log(A) diagram to dark asteroids may place significant uncertainty on retrievals of their geometric albedo. Asteroid (3200) Phaethon potentially belongs to the F type of very dark asteroids (Tholen 1985), although this is not entirely certain (Fornasier et al. 2006).
It is important that Phaethon is a near-Earth asteroid that can be observed at a very large phase angle α ~90°, and thus, its maximum linear polarization can be inferred from ground-based observations. Moreover, on occasion of a close encounter with Earth, Phaethon can be studied in the radar mode, which may deliver its geometric cross section. The latter is critically important for estimating the geometric albedo of the Phaethon surface from its photometric response. These two factors make it possible to investigate the manifestation of the Umov effect in its classic form on Phaethon and compare it with what was found on the Moon.
At α = 113°, the fits expressed with Eqs. (3) and (4) reveal a polarization P(113°) ≈ 53.6 and 42.6%, respectively; or, on average, P(113°) ≈ (48.1 ± 5.5)%. When formally applying P(113°) in asteroid (3200) Phaethon to the Umov diagram expressed for the Moon with Eq. (5), we can obtain A ≈0.024–0.029. This is an extremely low reflectance that is representative, for instance, of an optically thick layer of carbon soot smoked on a substrate and observed at similar phase angle (Zubko et al. 2002).
It is of high practical interest to compare this retrieval with the geometric albedo that emerges from the apparent brightness and projected area of Phaethon. It is defined as follows:
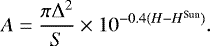 (6)
(6)
Equation (6) was obtained from Eq. (7.45) of Karttunen et al. (2007). Here, the geocentric distance Δ = 1 au is expressed in kilometers, S is the projected area of Phaethon measured in square kilometers, and H and HSun stand for the absolute magnitude of Phaethon and the apparent magnitude of the Sun at a distance of r = 1 au, correspondingly. Clearly, H and HSun should refer to the same photometric system. For instance, in the Johnson-Cousins R filter,  (Engelke et al. 2010).
We adopted the photometric response of Phaethon measured in the R filter at phase angle α ≈ 12°–83° from Ansdell et al. (2014). Although H is formally defined at α = 0°, we adjusted it to α = 3° for comparison with the Umov-diagram retrieval. Because the smallest α achieved in Ansdell et al. (2014) considerablyexceeds α = 3°, we used theextrapolated data, which suggest some uncertainty in our retrieval of the geometric albedo A with Eq. (6). Over the availablerange of α, Phaethon reveals a nearly linear change of its magnitude. When extrapolating this trend toward α =3°, we can estimate HR ≈ 14.44. However, as pointed out by Ansdell et al. (2014), photometric observations of Phaethon can also be reasonably well fit within the HG formalism, which yieldsHR ≈ 14.24 at α = 3°. In computations with Eq. (6) we investigate both values of HR. It is also worth noting that the range HR ≈ 14.44–14.24 may be further increased through temporal variations of the Phaethon apparent magnitude, which can be as high as Δ m≈ 0.2–0.4 (e.g., Ansdell et al. 2014; Hanuš et al. 2016). It also is worth noting that although we consider the HG formalism and linear-fit predictions of HR to be equally possible, this is not necessarily true. At exact backscattering, the difference in the absolute magnitude inferred with these two approaches is as high as 0.44. The brightness enhancement near backscattering that appears in the HG formalism might be attributed to the opposition effect (Shkuratov et al. 2004), whereas the difference in the absolute magnitude being 0.44 then corresponds to the opposition-effect (OE) amplitude. Interestingly, the OE amplitude correlates with the geometric albedo, and according toShevchenko et al. (2010), an OE amplitude of 0.44 should correspond to the geometric albedo of Phaethon being ~ 0.2, which is considerablyhigher than all estimations. Conversely, the dark surface of Phaethon suggests that the OE amplitude is much lower than it appears from the difference in the HG formalism and the linear fit. This may indicate that the absolute magnitude inferred with the HG formalism is not adequate for Phaethon. This is a subject for further photometric study of Phaethon at small phase angles, <10°. Since we used in our analysis an estimate of the Phaethon diameter on average, ~ 5.7 km according to Taylor et al. (2018) and Taylor (priv. comm.), we did not take into account the short-term brightness variations either.
Equation (6) yields AR ≈ 0.068 at HR ≈ 14.44 and AR ≈ 0.082 at HR ≈ 14.24; or, on average, AR ≈ 0.075 ± 0.007. This value appears to be considerably lower than the IRAS estimate (0.1066 ± 0.001), and it is simultaneously a few times greater than what was inferred from the Umov effect. Nevertheless, AR ≈ 0.075 ± 0.007 appears to be consistent with dark F-type asteroids, as which Phaethon was first classified. In the diagram in Fig. 3, we show a data point corresponding to Phaethon with a black square with the corresponding error bars. Figure 3 shows that the Umov diagram obtained for the Moon cannot be extrapolated for the case of asteroids. This indicates some difference in the chemical composition and/or structure of regolith on the Moon and Phaethon.
The structure of regolith is largely governed by space weathering, that is, ion and micro-meteoroid bombardment and heating or cooling. Micrometeoroid bombardment is capable of melting regolith particles. For instance, in mature lunar soils, the fraction of such particles could be as high as 70% (McKay et al. 1991). Phaethon approaches the Sun at much closer distances than the Moon. Its perihelion lies at r ≈ 0.14 AU, which in the blackbody approximation suggests that the temperature of its uppermost regolith is  . Other models predict somewhat stronger heating, of up to 800–1100 K, in the subsolar point (Ohtsuka et al. 2009). Although this is considerably higher than on the Moon, T ~ 400 K, it is too low to melt refractory species in asteroids; strong heating may cause some changes in regolith, however (Ohtsuka et al. 2009). More importantly, at smaller heliocentric distances, the flux of micrometeoroids and their velocity tend to increase. Therefore, we would expect more intense processing of regolith on Phaethon at r ≈ 0.14 AU than at the Moon at r ≈ 1 AU. The difference in the space weathering of the Moon and Phaethon could result, for instance, in different sizes of regolith particles. This is a long-known factor affecting the Umov diagram of regolith (e.g., Kiselev et al. 1990; Shkuratov & Opanasenko 1992; Worms et al. 1999; Hadamcik et al. 2009). This could be a reason for the different manifestations of the Umov effecton the Moon and Phaethon, although according to the second law of Kepler, Phaethon spends only ~15% of its orbital period (~523.5 days) at r < 1 AU, and the rest of the orbital period is spent at r > 1 AU, implying a weaker space weathering of regolith. Moreover, regolith that is produced by space weathering could be removed from an asteroid that experiences close encounters with Earth as a result of tidal force (Binzel et al. 2010). This phenomenon is expected to refresh the asteroid surface on a timescale of < 106 yr. On the other hand, no such refreshed asteroids have been detected so far.
Finally, although Phaethon does appear peculiar on the Umov diagram compared to what was found in 21 sites on the lunar surface, close analogs of the Phaethon response can be found in laboratory measurements. This was demonstrated by Ito et al. (2018) using measurements of meteorites and lunar and terrestrial samples. We also draw attention to the quantitative accordance of Pmax and A measured in Phaethonwith that was reported for dark volcanic sand (see Fig. 7 of Zubko et al. 2016). These examples aim to show that Phaethon aswell as other asteroids might be consistent with the Umov effect, whose quantitative characterization requires further efforts.
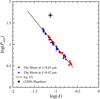 |
Fig. 3 Inverse correlation between log(A) and log (Pmax), i.e., the Umov effect, as measured in 21 different sites on the Moon in blue and red light, shown with blue triangles and red points, correspondingly (data adapted from Shkuratov & Opanasenko 1992), and their linear fit plotted as the black solid line, which is computed with Eq. (6). The black square corresponds to Phaethon. |
5 Conclusion
On its closest approach with Earth in December 2017, asteroid (3200) Phaethon provided the rare opportunity of measuring its linear polarization at large phase angles. Using the 22-cm telescope of the Ussuriysk Astrophysical Observatory, we measured the degree of linear polarization at two phase angles α ≈57.9° and 73.2°. The comparative analysis of these observational data sets with those obtained in two previous epochs suggest no wavelength dependence of the polarization of Phaethon that would exceed the error bars in our measurements, at least at phase angle α ≈ 58°. The surface of Phaethon is presumably heterogeneous, as demonstrated by its polarimetric response. Polynomial fits to observations previously reported in Ito et al. (2018) and Devogèle et al. (2018) suggest two types of regolith on Phaethon, whose maximum linear polarization is Pmax ≈ 57.9 and 44.5%, respectively. Our polarimetric measurement at α ≈ 73.2° reveals a third type of regolith.
We also considered the Umov effect, an inverse correlation between the polarization maximum Pmax and the geometric albedo A of Phaethon regolith. We find that the Umov diagram previously inferred for the Moon by Shkuratov & Opanasenko (1992) is hardly applicable to Phaethon, and as a consequence, neither can it be applied to other asteroids. This could reflect different circumstances in the space weathering that the lunar and Phaethon surface underwent. However, this finding also encourages further study of the Umov-effect manifestation in asteroids, in particular, as a function of their perihelion distance.
Acknowledgements
O.I. thanks the SASPRO Programme, the People Programme (Marie Curie Actions) of the European Union’s Seventh Framework Programme under REA grant agreement No. 609427, and the Slovak Academy of Sciences (grant Vega 2/0023/18). The research of I.L. is supported by the National Scholarship Programme of the Slovak Republic (SAIA). The authors alsothank Gorden Videen, Yuriy Shkuratov, and Masateru Ishiguro for valuable comments on this work, and two anonymous referees for their constructive reviews.
References
- Arai, T., Kobayashi, M., Ishibashi, K., et al. 2018, 49th Lun. Planet. Sci. Conf., 2570 [Google Scholar]
- Ansdell, M., Meech, K. J., Hainaut, O., et al. 2014, ApJ, 793, 50 [NASA ADS] [CrossRef] [Google Scholar]
- Binzel, R. P., Morbidelli, A., Merouane, S., et al. 2010, Nature, 463, 331 [Google Scholar]
- Cellino, A., Bagnulo, S., Gil-Hutton, R., et al. 2015, MNRAS, 451, 3473 [NASA ADS] [CrossRef] [Google Scholar]
- Devogèle, M., Cellino, A., Borisov, G., et al. 2018, MNRAS, 479, 3498 [NASA ADS] [CrossRef] [Google Scholar]
- Dollfus, A., Bowell, E., & Titulaer, C. 1971, A&A, 10, 450 [NASA ADS] [Google Scholar]
- Engelke, C. W., Price, S. D., & Kraemer, K. E. 2010, AJ, 140, 1919 [NASA ADS] [CrossRef] [Google Scholar]
- Fesenkov, V. G. 1935, Astron. Zh., 12, 309 [Google Scholar]
- Fornasier, S., Belskaya, I. N., Shkuratov, Y. G., et al. 2006, A&A, 455, 371 [NASA ADS] [CrossRef] [EDP Sciences] [Google Scholar]
- Hadamcik, E., Renard, J.-B., Levasseur-Regourd, A. C., et al. 2009, J. Quant. Spectr. Rad. Transf., 110, 1755 [NASA ADS] [CrossRef] [Google Scholar]
- Hanuš, J., Delbo’, M., Vokrouhlický, D., et al. 2016, A&A, 592, A34 [NASA ADS] [CrossRef] [EDP Sciences] [Google Scholar]
- Hapke, B. 1993, Theory of Reflectance and Emittance Spectroscopy (Cambridge: Cambridge University Press) [Google Scholar]
- Heiles, C. 2000, AJ, 119, 923 [NASA ADS] [CrossRef] [Google Scholar]
- Hines, D. C., Videen, G., Zubko, E., et al. 2014, ApJ, 780, L32 [NASA ADS] [CrossRef] [Google Scholar]
- Hsu, J.-C., & Breger, M. 1982, AJ, 262, 732 [Google Scholar]
- Ishiguro, M., Nakayama, H., Kogachi, M., et al. 1997, PASJ, 49, L31 [NASA ADS] [CrossRef] [Google Scholar]
- Ito, T., Ishiguro, M., Arai, T., et al. 2018, Nat. Comm., 9, 2486 [NASA ADS] [CrossRef] [Google Scholar]
- Ivanova, O. V., Dlugach, J. M., Afanasiev, V. L., Reshetnyk, V. M., & Korsun, P. P. 2015, Planet. Space Sci., 118, 199 [NASA ADS] [CrossRef] [Google Scholar]
- Jewitt, D. 2012, AJ, 143, 66 [NASA ADS] [CrossRef] [Google Scholar]
- Karttunen, H., Krüger, P., Oja, H., Poutanen, M., & Donner, K. J. 2007, Fundamental Astronomy (Berlin, Germany: Springer), 153 [Google Scholar]
- Kiselev, N. N., Lupishko, D. F., Chernova, G. P., et al. 1990, Kinematika i Fizika Nebesnykh Tel, 6, 77 [NASA ADS] [Google Scholar]
- Krugly, Y. N., Belskaya, I. N., Shevchenko, V. G., et al. 2002, Icarus, 158, 294 [NASA ADS] [CrossRef] [Google Scholar]
- Lumme, K., & Muinonen, K. 1993, IAU Symp., 160, 194 [NASA ADS] [Google Scholar]
- McKay, D., Heiken, G., Basu, A., & Blanford, G. 1991, in Lunar Sourcebook, eds. G. H. Heiken, D. T. Vaniman, & B. M. French, (Cambridge: Cambridge University Press), 285 [Google Scholar]
- Ohtsuka, K., Nakato, A., Nakamura, T., et al. 2009, PASJ, 61, 1375 [NASA ADS] [Google Scholar]
- Penttilä, A., Lumme, K., Hadamcik, E., & Levasseur-Regourd, A.-C. 2005, A&A, 432, 1081 [NASA ADS] [CrossRef] [EDP Sciences] [Google Scholar]
- Schmidt, G. D., Elston, R., & Lupie, O. L. 1992, AJ, 104, 1563 [NASA ADS] [CrossRef] [Google Scholar]
- Shevchenko, V. G., Belskaya, I. N., Tereschenko, I. A. 2010, 41st Lun. Planet. Sci. Conf., 1131 [Google Scholar]
- Shkuratov, I. G., & Opanasenko, N. V. 1992, Icarus, 99, 468 [NASA ADS] [CrossRef] [Google Scholar]
- Shkuratov, Yu., Videen, G., Kreslavsky, M., et al. 2004, in Photopolarimetry in Remote Sensing, eds. G. Videen, Ya. Yatskiv, & M. Mishchenko (Dordrecht, Netherlands: Kluwer Academic Publishers), 161 [Google Scholar]
- Shkuratov, Yu., Zubko, E., & Videen, G. 2018, Icarus, 296, 117 [NASA ADS] [CrossRef] [Google Scholar]
- Taylor, P. A., Marshall, S. E., Venditti, F., et al. 2018, 49th Lun. Planet. Sci. Conf., 2509 [Google Scholar]
- Tedesco, E. F., Noah, P. V., Noah, M., & Price, S. D. 2002, AJ, 123, 1056 [Google Scholar]
- Tholen, D. J. 1985, IAU Circ., 4034 [Google Scholar]
- Umov, N. A. 1905, Phis. Zeits. 6, 674 [Google Scholar]
- Worms, J.-C., Renard, J.-B., Hadamcik, E., Levasseur-Regourd, A.-C., & Gayet, J.-F. 1999, Icarus, 142, 281 [NASA ADS] [CrossRef] [Google Scholar]
- Williams, I. P., & Wu, Z. 1993, MNRAS, 262, 231 [NASA ADS] [Google Scholar]
- Zellner, B., Gehrels, T., & Gradie, J. 1974, AJ, 79, 1100 [NASA ADS] [CrossRef] [Google Scholar]
- Zubko, E., Ovcharenko, A., & Shkuratov, Yu. 2002, Opt. Spectr., 92, 443 [NASA ADS] [CrossRef] [Google Scholar]
- Zubko, E., Videen, G., Shkuratov, Y., Muinonen, K., & Yamamoto, T. 2011, Icarus, 212, 403 [NASA ADS] [CrossRef] [Google Scholar]
- Zubko, N., Gritsevich, M., Zubko, E., Hakala, T., & Peltoniemi, J. I. 2016, J. Quant. Spectr. Rad. Transf., 178, 422 [NASA ADS] [CrossRef] [Google Scholar]
- Zubko, E., Videen, G., Zubko, N., & Shkuratov, Y. 2018, MNRAS, 477, 4866 [NASA ADS] [CrossRef] [Google Scholar]
All Tables
All Figures
|
Fig. 1 Response of the CCD detector used in our observations vs. transmittance of the V and R filters in theJohnson-Cousins photometric system. |
| In the text | |
|
Fig. 2 Degree of linear polarization P as a functionof phase angle α in asteroid (3200) Phaethon obtained in three different epochs by four different groups (symbols) and polynomial fits (lines) to the observational data obtained in Ito et al. (2018) and Devogèle et al. (2018). |
| In the text | |
|
Fig. 3 Inverse correlation between log(A) and log (Pmax), i.e., the Umov effect, as measured in 21 different sites on the Moon in blue and red light, shown with blue triangles and red points, correspondingly (data adapted from Shkuratov & Opanasenko 1992), and their linear fit plotted as the black solid line, which is computed with Eq. (6). The black square corresponds to Phaethon. |
| In the text | |
Current usage metrics show cumulative count of Article Views (full-text article views including HTML views, PDF and ePub downloads, according to the available data) and Abstracts Views on Vision4Press platform.
Data correspond to usage on the plateform after 2015. The current usage metrics is available 48-96 hours after online publication and is updated daily on week days.
Initial download of the metrics may take a while.