Fig. 3
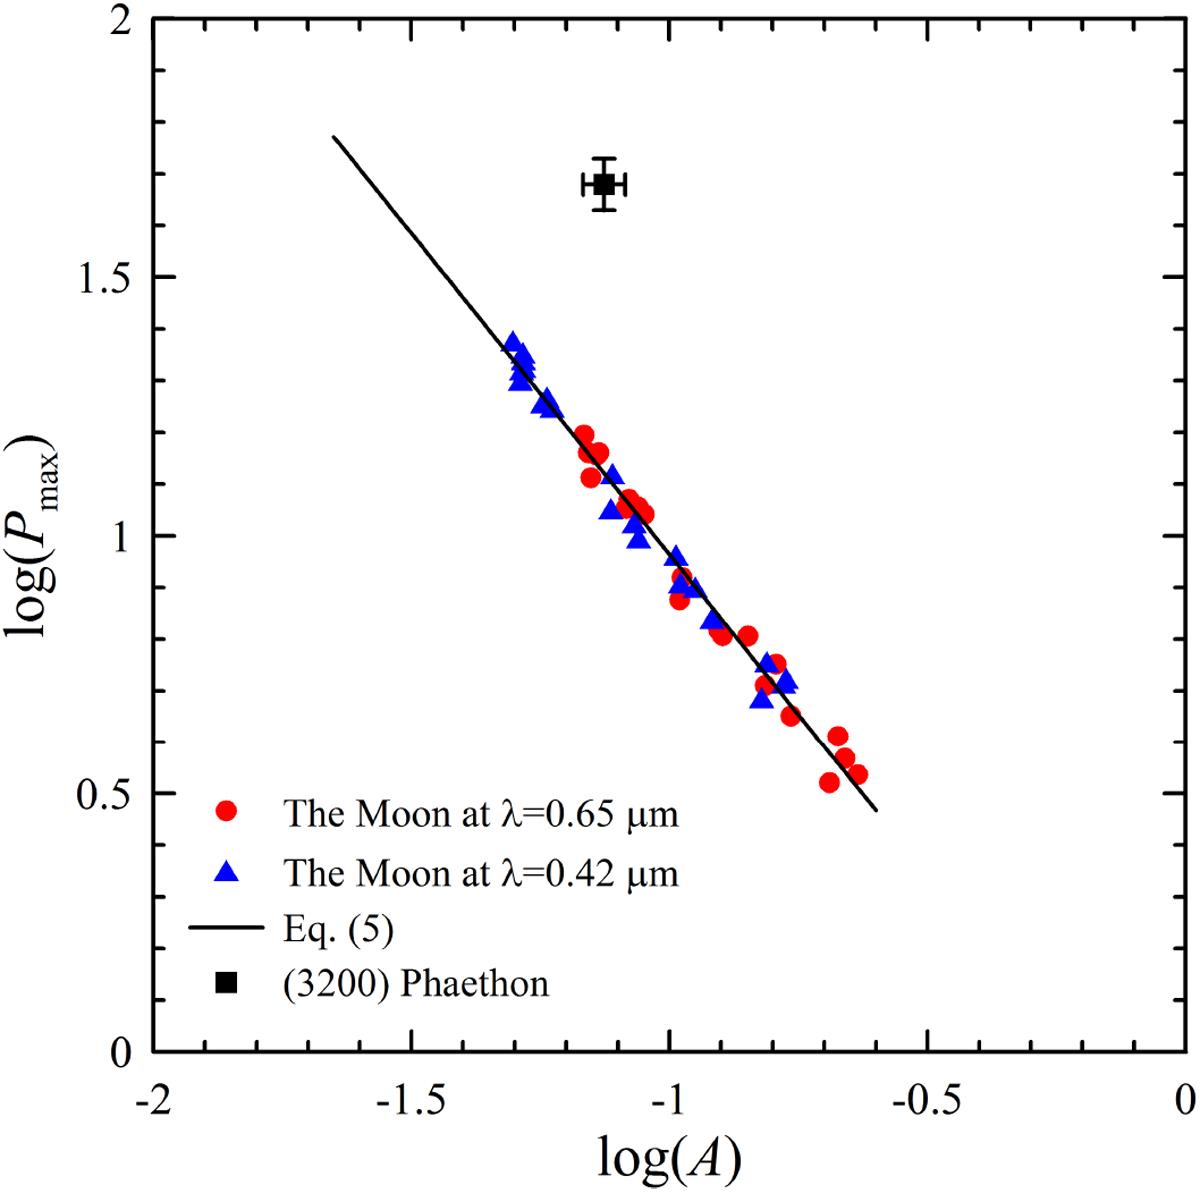
Inverse correlation between log(A) and log (Pmax), i.e., the Umov effect, as measured in 21 different sites on the Moon in blue and red light, shown with blue triangles and red points, correspondingly (data adapted from Shkuratov & Opanasenko 1992), and their linear fit plotted as the black solid line, which is computed with Eq. (6). The black square corresponds to Phaethon.
Current usage metrics show cumulative count of Article Views (full-text article views including HTML views, PDF and ePub downloads, according to the available data) and Abstracts Views on Vision4Press platform.
Data correspond to usage on the plateform after 2015. The current usage metrics is available 48-96 hours after online publication and is updated daily on week days.
Initial download of the metrics may take a while.