Fig. 9
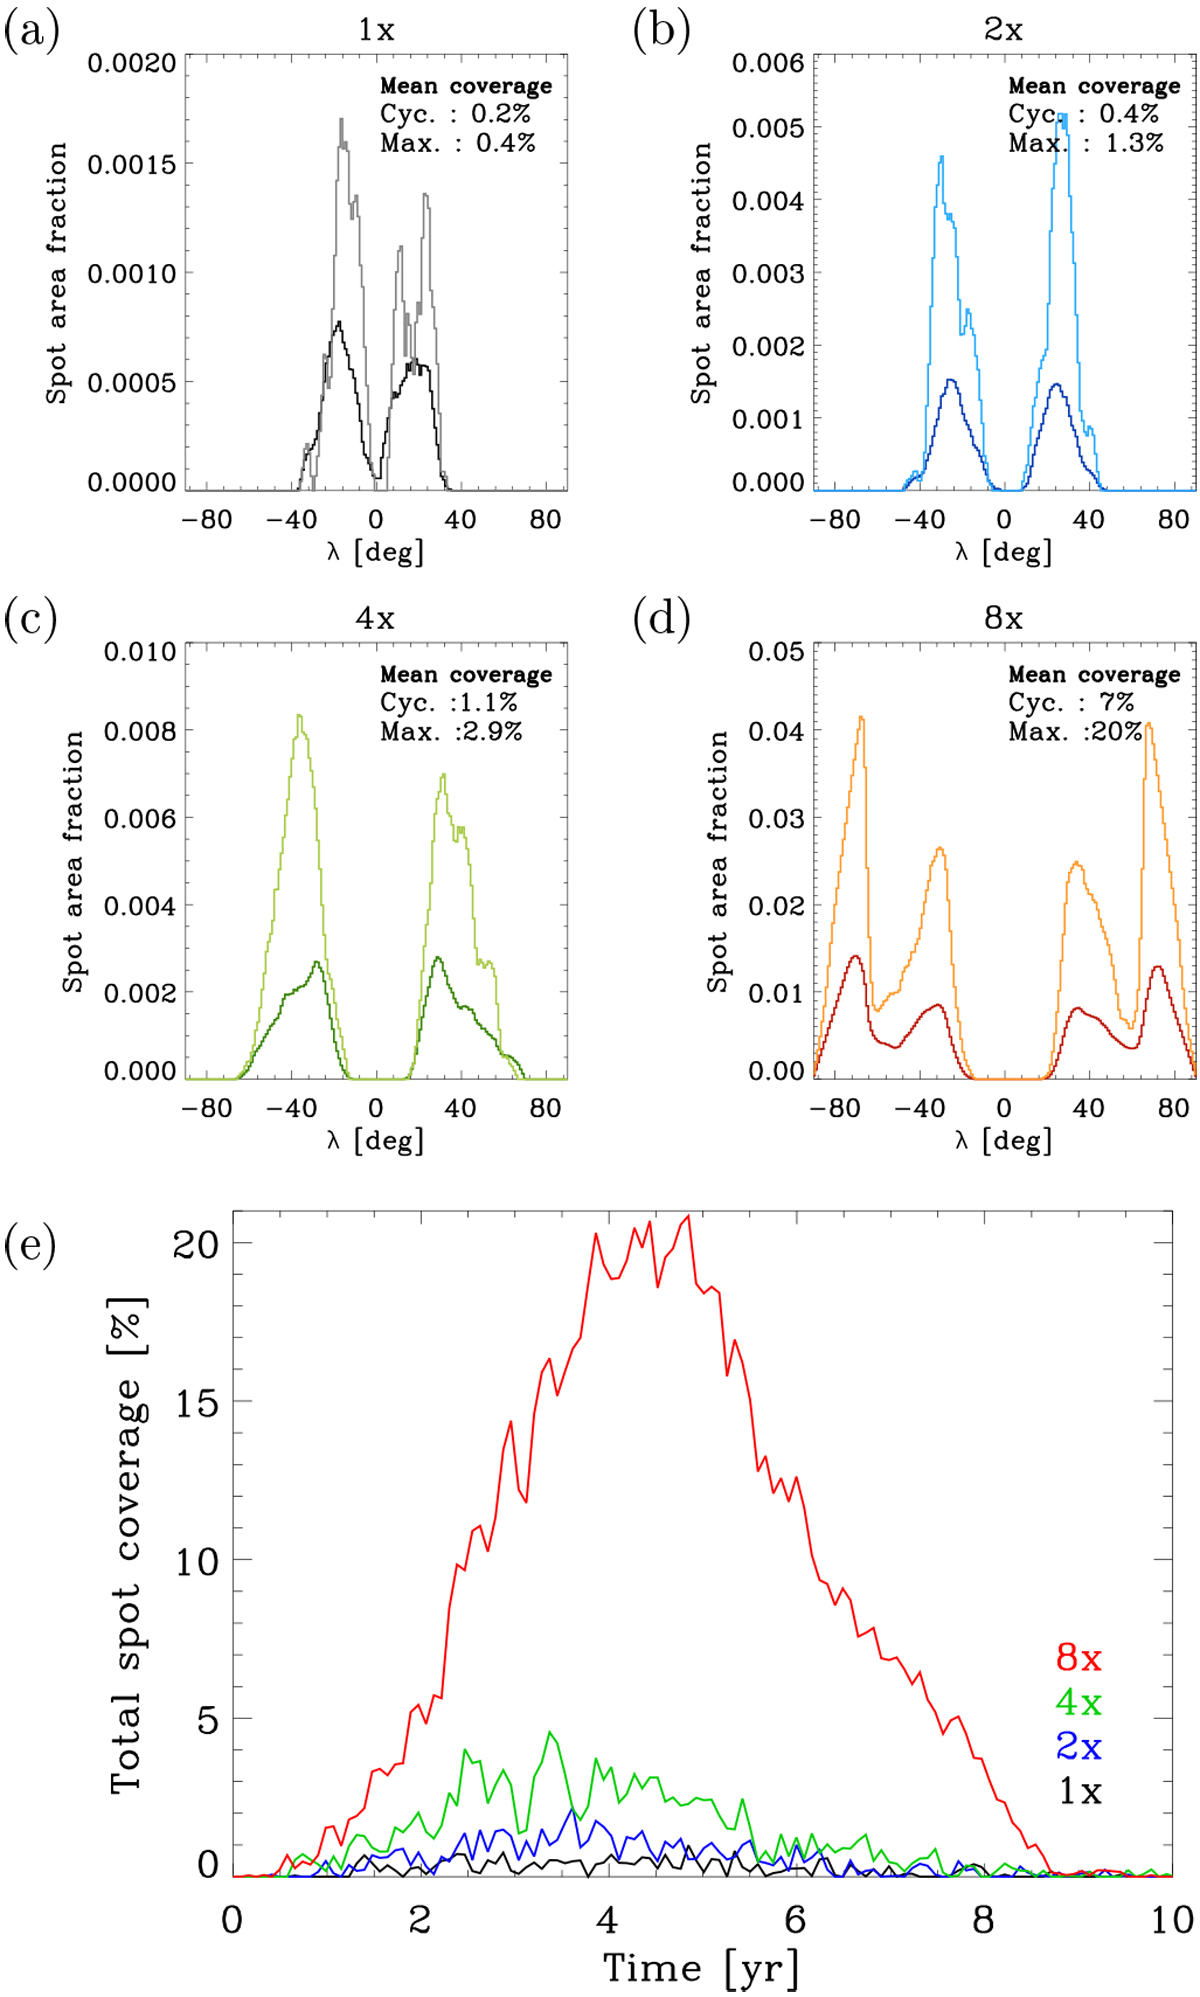
Time-averaged latitudinal distributions of the fraction of surface area covered by starspots for ![]() (panel a),
(panel a), ![]() (panel b),
(panel b), ![]() (panel c), and
(panel c), and ![]() (panel d), where
(panel d), where ![]() , given at the top of each panel. The colours correspond to the cases in Figs. 3 and 6; lighter ones are averages over a one-year window centred at the activity maximum and darker curves represent cycle averages. Time-averaged surface coverages for maxima and whole-cycles are given inside each plot. Panel e: variation of the total spot coverage for each case.
, given at the top of each panel. The colours correspond to the cases in Figs. 3 and 6; lighter ones are averages over a one-year window centred at the activity maximum and darker curves represent cycle averages. Time-averaged surface coverages for maxima and whole-cycles are given inside each plot. Panel e: variation of the total spot coverage for each case.
Current usage metrics show cumulative count of Article Views (full-text article views including HTML views, PDF and ePub downloads, according to the available data) and Abstracts Views on Vision4Press platform.
Data correspond to usage on the plateform after 2015. The current usage metrics is available 48-96 hours after online publication and is updated daily on week days.
Initial download of the metrics may take a while.