Fig. 2
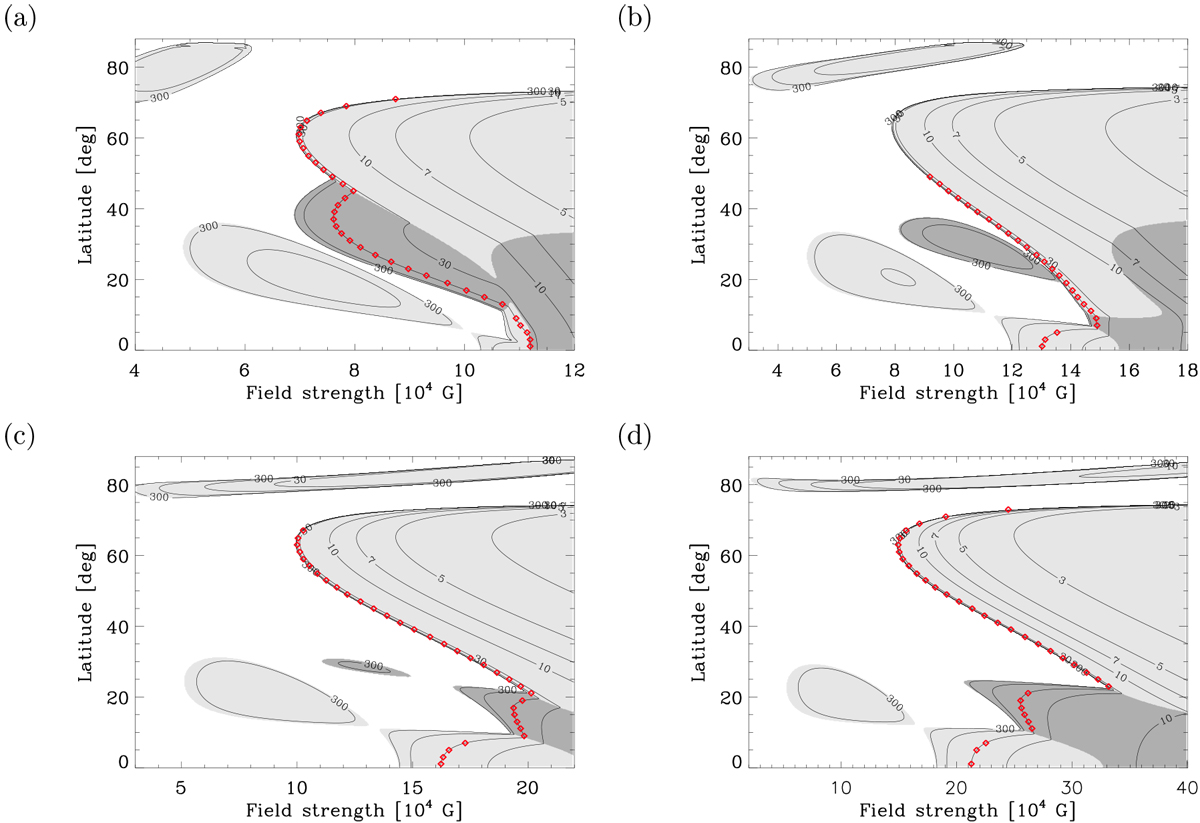
Initial latitudes and field strengths of flux tubes (red diamonds) chosen for flux-tube rise computations, plotted over linear stability diagrams for flux tubes at the middle of the overshoot region, for![]() (panel a),
(panel a), ![]() (panel b),
(panel b), ![]() (panel c), and
(panel c), and ![]() (panel d), with differential rotation ΔΩ⋆ = ΔΩ⊙. The contour lines denote the growth time in days. The linearly stable regime is shown in white, and the unstable regime is shaded with light grey where the fastest-growing mode is m = 1, and with dark-grey for m = 2. The red diamonds show the initial tube parameters chosen for the numerical simulations, at a growth time of 50 days.
(panel d), with differential rotation ΔΩ⋆ = ΔΩ⊙. The contour lines denote the growth time in days. The linearly stable regime is shown in white, and the unstable regime is shaded with light grey where the fastest-growing mode is m = 1, and with dark-grey for m = 2. The red diamonds show the initial tube parameters chosen for the numerical simulations, at a growth time of 50 days.
Current usage metrics show cumulative count of Article Views (full-text article views including HTML views, PDF and ePub downloads, according to the available data) and Abstracts Views on Vision4Press platform.
Data correspond to usage on the plateform after 2015. The current usage metrics is available 48-96 hours after online publication and is updated daily on week days.
Initial download of the metrics may take a while.