Fig. 10.
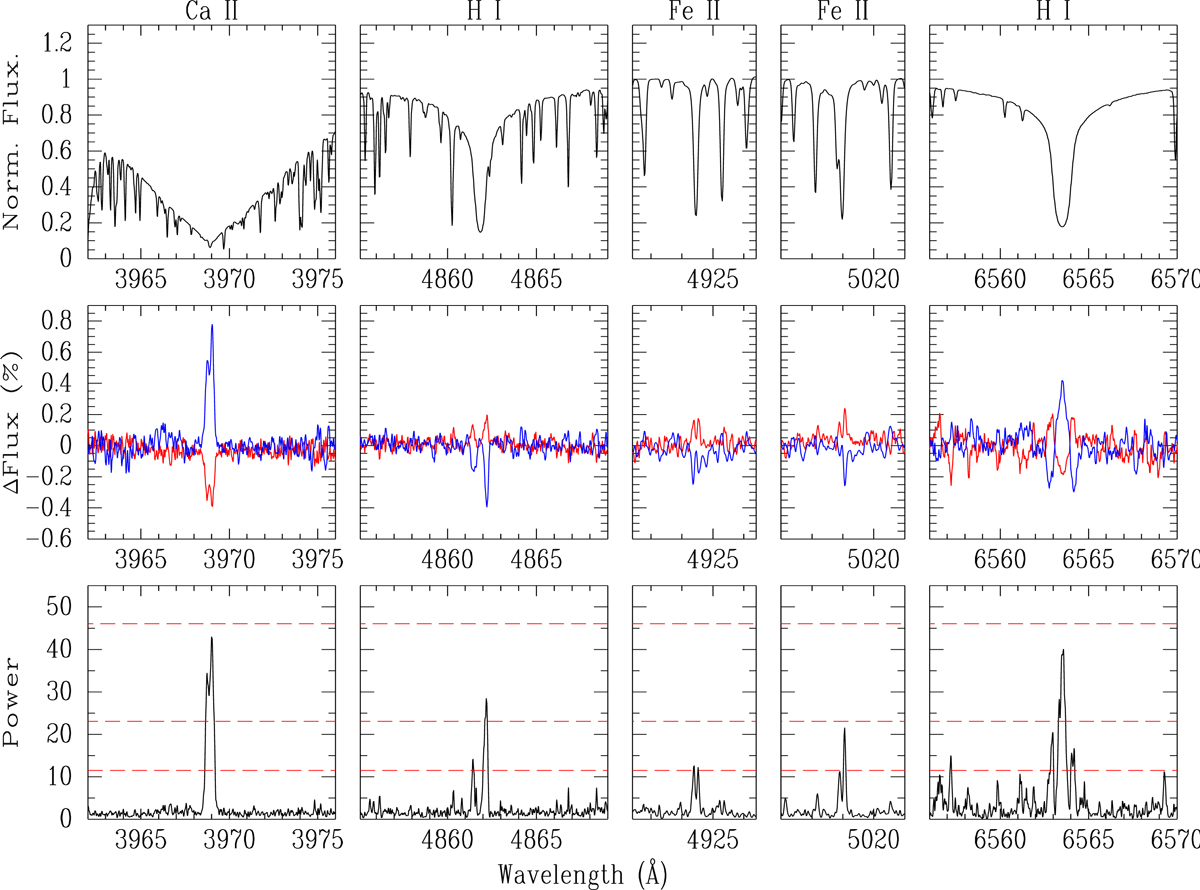
Spectral variation of optical lines. Upper panel: mean spectra near the lines Ca II H, Hβ, Fe II 4924 Å, Fe II 5018 Å, and Hα. Middle panel: differences between the high-activity (blue line) mean spectrum and the mean reference spectrum and the low-activity (red solid line) mean spectrum and the mean reference spectrum. Lower panel: periodogram height at P = 3940 d for each spectrum pixel. Horizontal dashed lines correspond to FAP = 10−5, 10−10, and 10−15 (see text for explanation).
Current usage metrics show cumulative count of Article Views (full-text article views including HTML views, PDF and ePub downloads, according to the available data) and Abstracts Views on Vision4Press platform.
Data correspond to usage on the plateform after 2015. The current usage metrics is available 48-96 hours after online publication and is updated daily on week days.
Initial download of the metrics may take a while.