Free Access
Fig. 1.
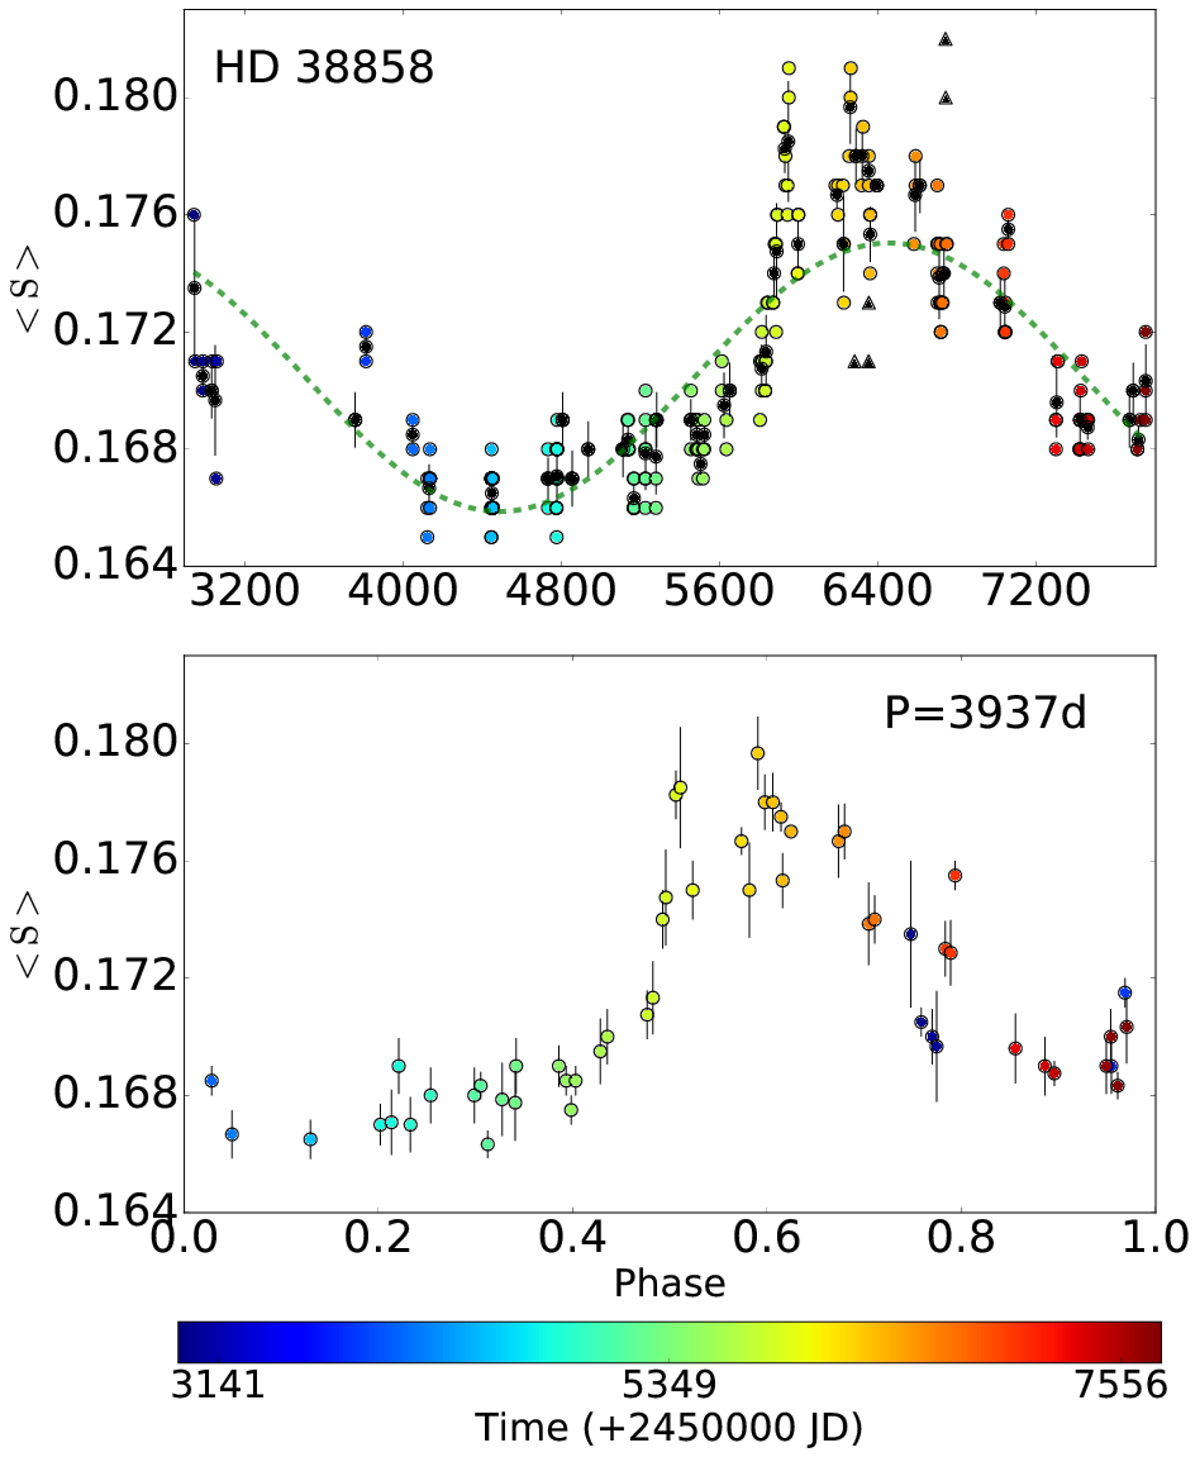
Upper panel: individual SMW measurements (coloured circles) and seasonal means (black full circles) from HARPS observations. The black triangles correspond to CASLEO data. The dotted green line shows a harmonic curve with the cycle calculated in this work. Lower panel: Mt Wilson index phased with a 10.8 yr period.
Current usage metrics show cumulative count of Article Views (full-text article views including HTML views, PDF and ePub downloads, according to the available data) and Abstracts Views on Vision4Press platform.
Data correspond to usage on the plateform after 2015. The current usage metrics is available 48-96 hours after online publication and is updated daily on week days.
Initial download of the metrics may take a while.