Fig. 4
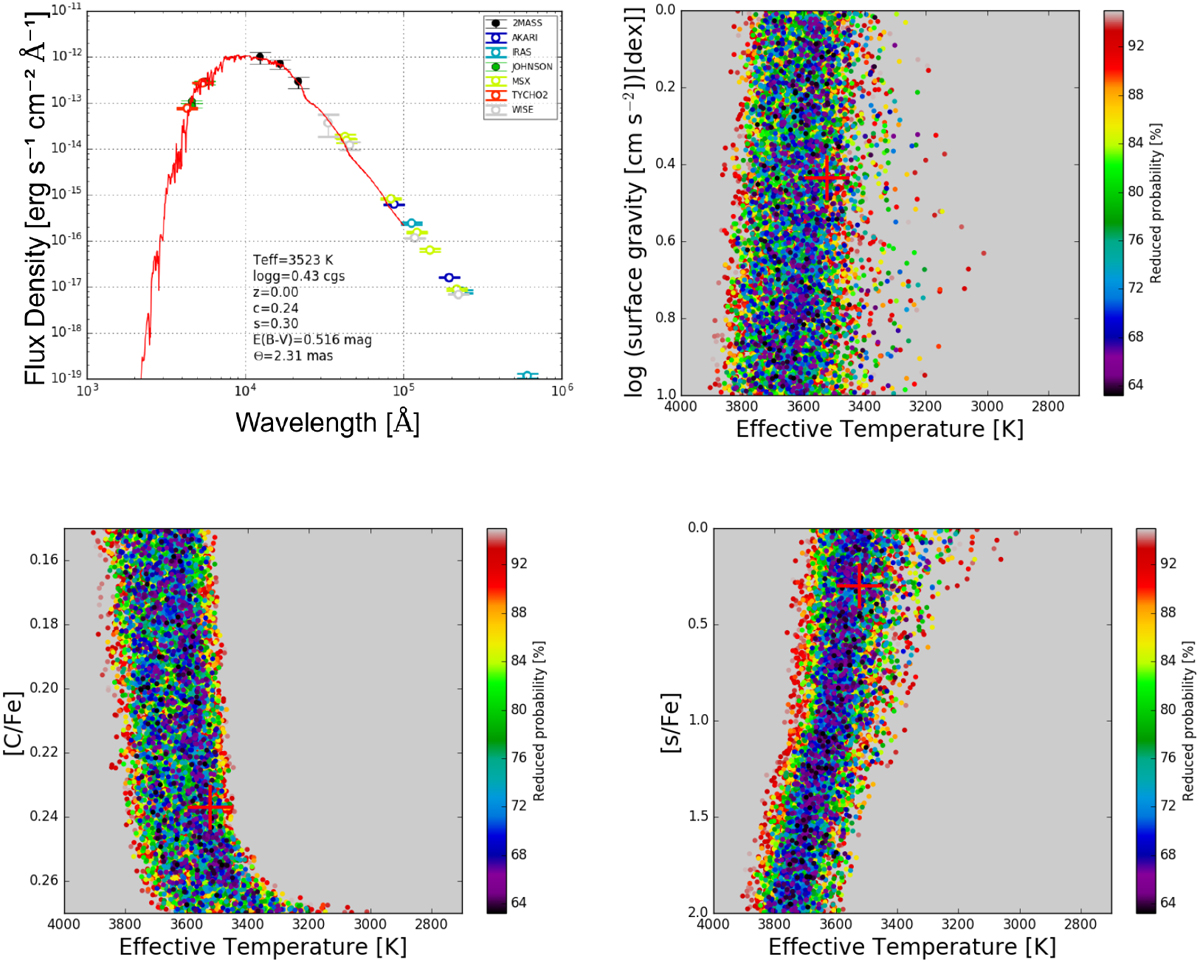
Top left panel: SED fitting of V915 Aql using S4U where the red line represents the MARCS model best matching the photometric observations collected from SIMBAD. Top right panel: probability distribution plot of log g vs Teff for V915 Aql obtained using S4U. Bottom left panel: same as top right panel but for [C/Fe] vs Teff and bottom rightpanel for [s/Fe] vs Teff. The red plus sign in top right, bottom left and right panels indicates the best model selected by S4U.
Current usage metrics show cumulative count of Article Views (full-text article views including HTML views, PDF and ePub downloads, according to the available data) and Abstracts Views on Vision4Press platform.
Data correspond to usage on the plateform after 2015. The current usage metrics is available 48-96 hours after online publication and is updated daily on week days.
Initial download of the metrics may take a while.