Fig. 15
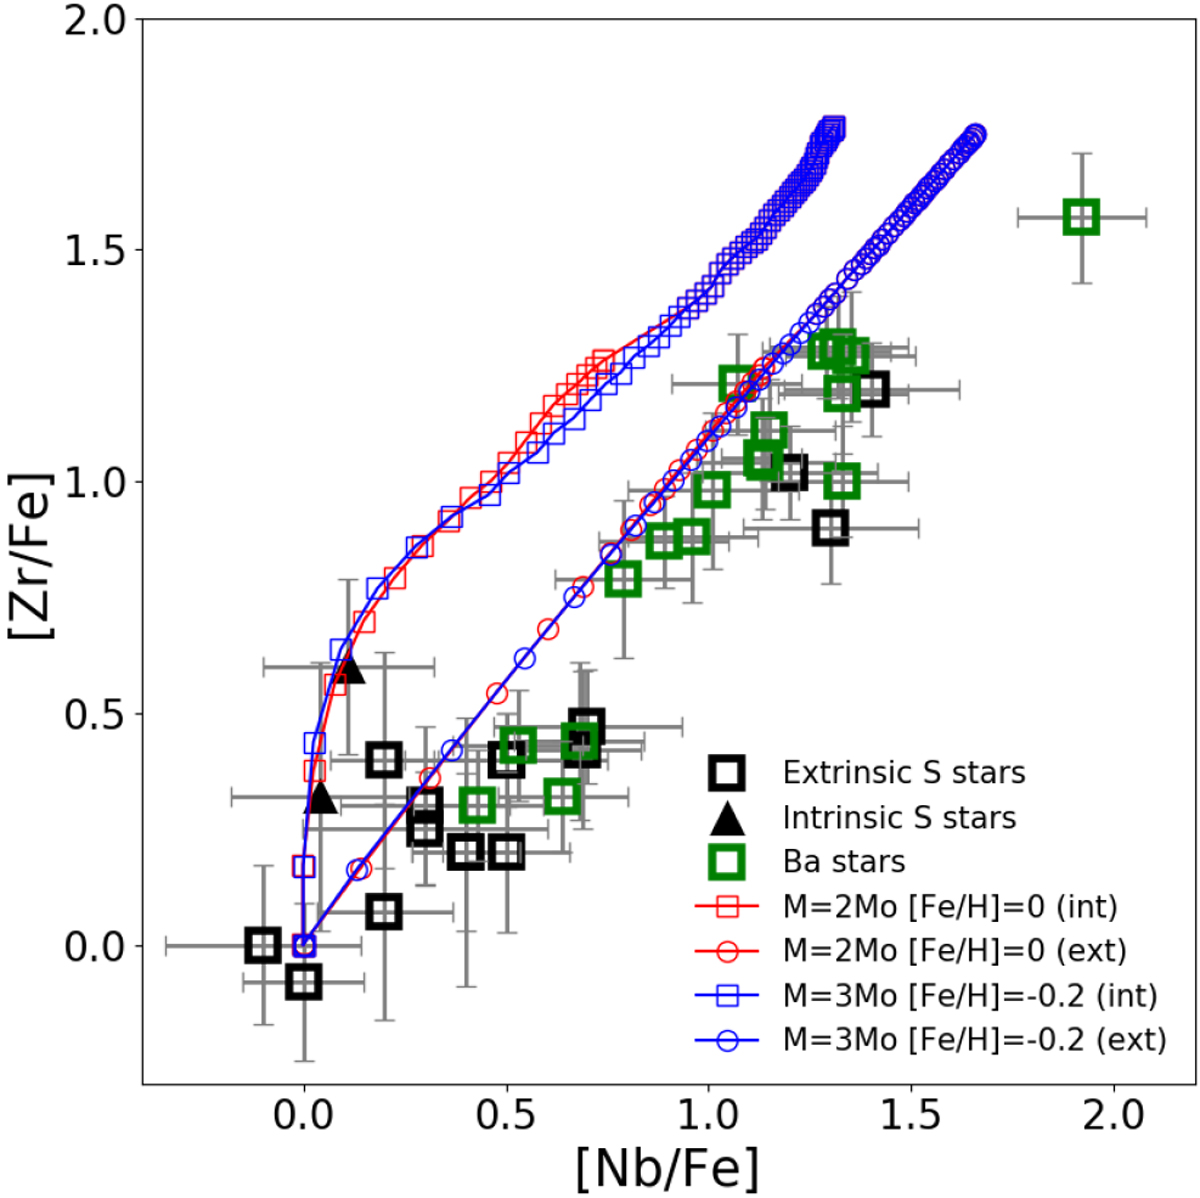
The ([Zr/Fe], [Nb/Fe]) plane. Different kinds of stars are represented by different symbols as labelled in the lower right corner. Abundances for the barium stars are from Karinkuzhi et al. (2018). The error bars on [Zr/Fe] and [Nb/Fe] represent the total uncertainty on the abundances. The red and blue line represent the surface abundance predictions from the models. Each thermal pulse is indicated by a symbol: circles correspond to surface abundances of extrinsic stars, i.e. after the full decay of 93 Zr into Nb, and squares to intrinsic S stars still on the TP-AGB.
Current usage metrics show cumulative count of Article Views (full-text article views including HTML views, PDF and ePub downloads, according to the available data) and Abstracts Views on Vision4Press platform.
Data correspond to usage on the plateform after 2015. The current usage metrics is available 48-96 hours after online publication and is updated daily on week days.
Initial download of the metrics may take a while.