Fig. 12
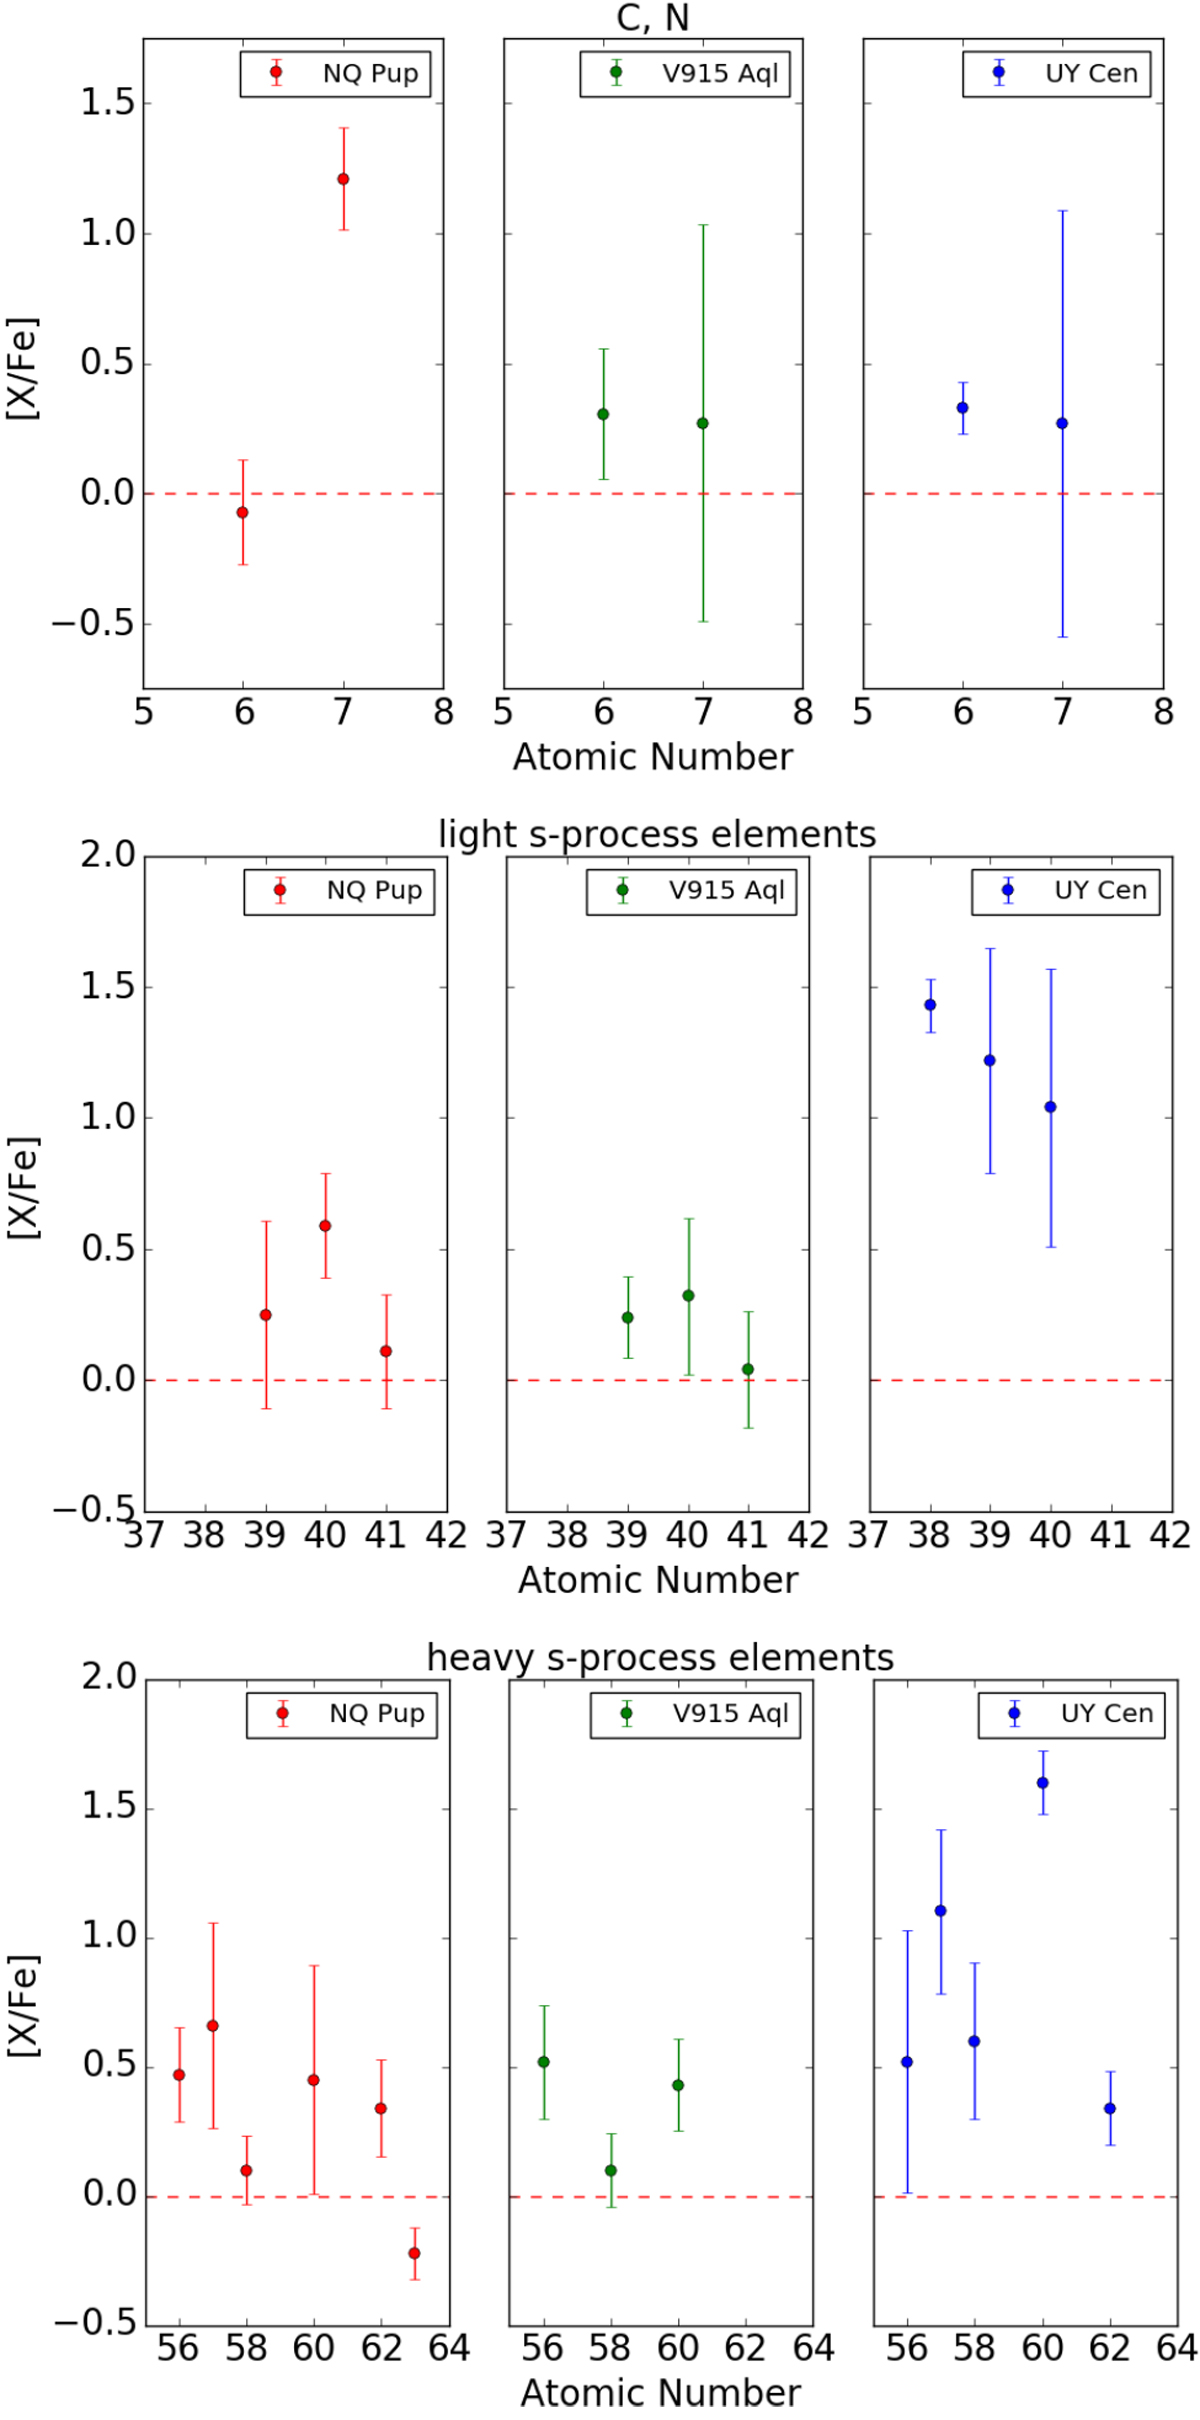
Abundances of the three intrinsic S stars, with C and N (top panel), light s-process elements (middle panel) and heavy s-process elements (bottom panel). The error bars on the elemental abundances represent the total uncertainty calculated by quadratically summing the Δ H−A values from the last columns of Tables 7–9 with the standard deviation due to line-to-line scatter, plusan extra 0.1 dex as uncertainty due to continuum placement.
Current usage metrics show cumulative count of Article Views (full-text article views including HTML views, PDF and ePub downloads, according to the available data) and Abstracts Views on Vision4Press platform.
Data correspond to usage on the plateform after 2015. The current usage metrics is available 48-96 hours after online publication and is updated daily on week days.
Initial download of the metrics may take a while.